Here is a collection of candlestick patterns that have a historical pattern of being bearish.
Click here to go to the list of Bullish Candlestick Patterns.
Three Black Crows
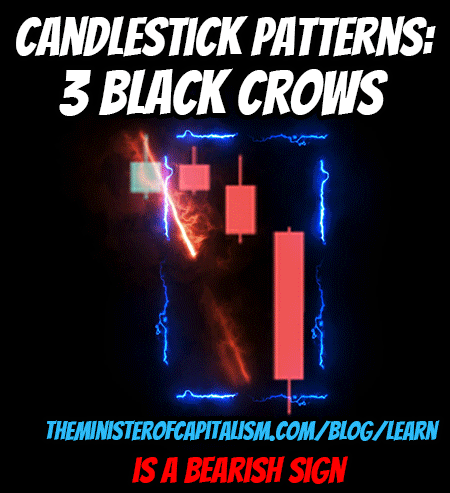
This is a bearish reversal pattern that forms at the peak of an uptrend.
It consists of three long bearish candlesticks trending down that show a strong reversal of price.
Two Black Gapping
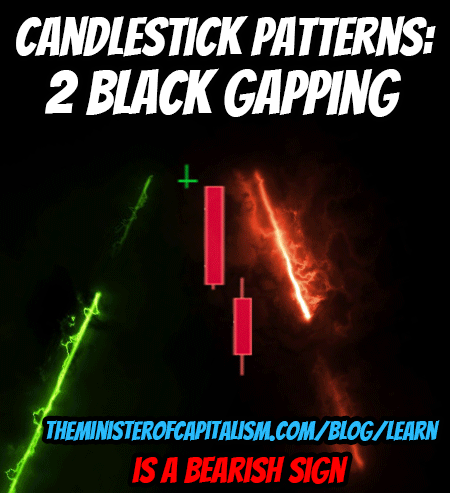
This pattern often shows up after notable top in an uptrend. The first bearish candle gaps down, and then the second bearish candlestick opens below previous candlestick and then closes below the close of the first bearish candle.
Dark Cloud Cover
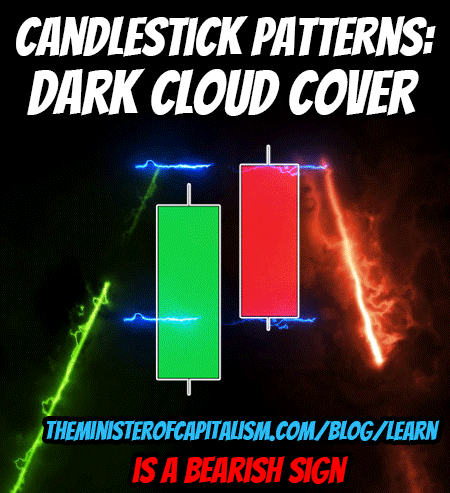 This is a two candlestick pattern. The first is a long bullish candlestick. The second candlestick opens above the previous close & finishes below the midpoint of the first bullish candlesticks’ body.
Shooting Star
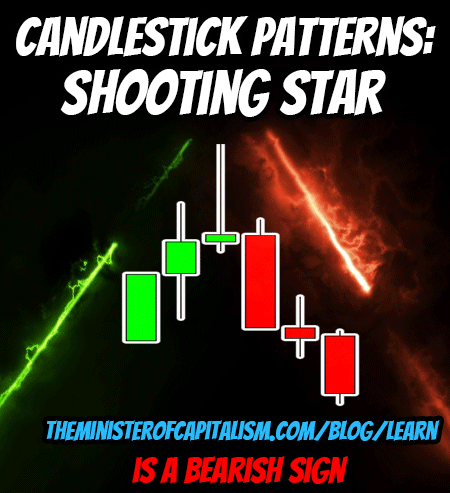 Shows after price top in uptrend and usually shows after three or more bullish candles that all have a series of higher highs.
When the stock opens the bulls push the price higher, but bears gain control and pull price down to win the day.
The next candlestick after this formation is used as confirmation of a bearish reversal.
This looks the same as an inverted hammer, the difference being that it shows up after a series of higher highs.
Bearish Harami
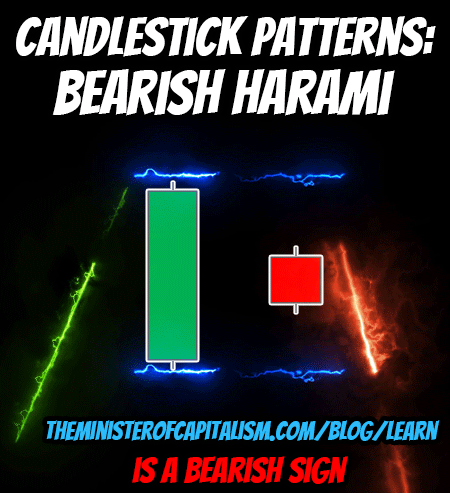
This pattern most often shows up near a resistance level after after a large bullish candle. The second candle is a smaller bearish candle (usually a spinning top) that shows up completely inside the previous days body.
Evening Star
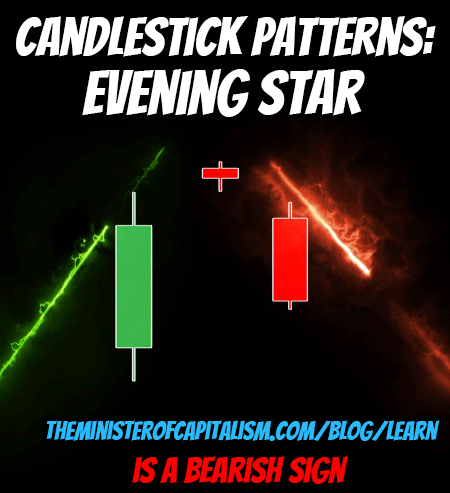 This pattern is made up of 3 candlesticks.
The first is a large bullish candle. The second day features a small candle with bullish gap up but it doesn’t push the price much higher. On the third day, there is a bearish gap down that often ends lower than the first bullish candlestick of the first day or at least closes well within the candle from the first day.
Hanging Man
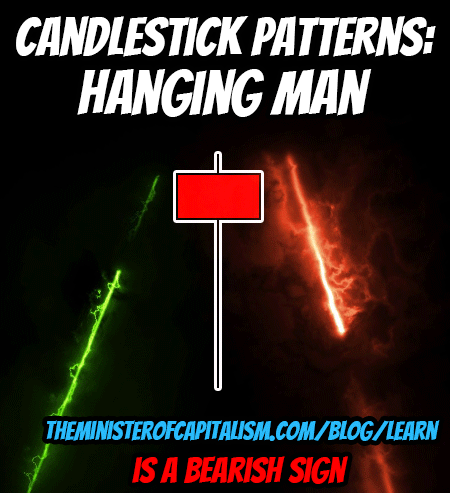
This pattern shows at the top of an uptrend & signals the bullish trend could reverse soon.
It is characterized as having a small body with long lower shadow at least two times the length of the body.
Bullish Engulfing
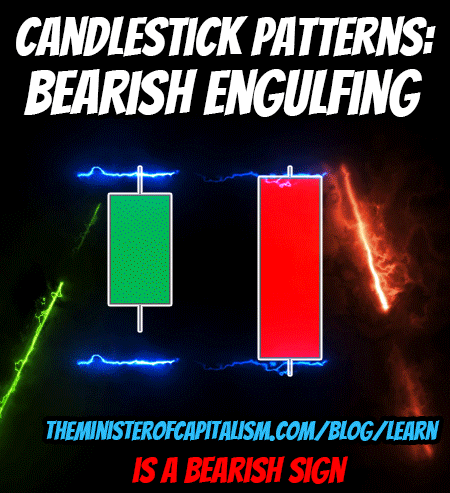
This pattern occurs at top of an uptrend. It consists of a bullish candlestick followed by a large bearish candlestick that eclipses or “engulfs” the smaller bullish candle that came before it.
Get Hedge Find Beating Options Trades Delivered to Your Inbox!
Tired of missing out on the huge gains in the market?
Wishing you knew which trades had the best odds of succeeding?
Would you like to know EXACTLY how & which trades to place WITHOUT having to spend years learning?
Well now you can let our Team of Trading Experts & Exclusive AI Trading Software do the work for you!
Click Here to Start Making Bank With Our Option Trade Alerts!
PS – Our trades have an average win rate around 94% and have returned QUADRUPLE digit yearly returns.