I’ve put together a list of some common technical analysis patterns that you’re likely to come across when looking at stock charts.
Learning to spot patterns like these are crucial to your development as a trader.
We’ve broken them up into the sections below, can you can also read our article that gives you a brief overview and introduction to getting started in technical analysis here:
Bullish Chart Patterns

Bullish Candlestick Patterns

Bearish Chart Patterns

Bearish Candlestick Patterns

Get Hedge Find Beating Options Trades Delivered to Your Inbox!
Tired of missing out on the huge gains in the market?
Wishing you knew which trades had the best odds of succeeding?
Would you like to know EXACTLY how & which trades to place WITHOUT having to spend years learning?
Well now you can let our Team of Trading Experts do the work for you!
Click Here to Start Making Bank With Our Option Trade Alerts!
[Beginner’s Guide] Getting Started in Technical Analysis In Trading

Are you new to trading & interested in learning about technical analysis? If so, this guide is for you. In this post, we’ll discuss what technical analysis is and how technical analysis can help you try and predict future prices. So let’s get started!
Getting started in technical analysis
To get started in Technical Analysis, you must have a solid understanding of the charts. Some basic questions that you need to know when evaluating any indicator are:
- What is an indicator?
- How do I use the chart?
- How do I interpret the data on the chart?
As technical analysis (also known as chartanalyse) attempts to analyze the price and volume of assets by looking at different indicators such as volume, volatility, market depth, etc you need to know the answers to the questions above in order to know what you’re trying to achieve & how the indicator might help.
What is technical analysis and how does it work
Technical analysis is the process of analyzing past and current financial data to predict future movements in a security’s price. This information can be used to make trading decisions, and practitioners of technical analysts have been using this technique since 1881.
Ultimately, technical analysis studies past market data to identify trends and predict future movements. The basic premise is that history tends to repeat itself and that by studying past patterns we can gain insight into what is most likely to happen in the future. Technical analysis is often used in conjunction with other tools, such as fundamental analysis, in order to make more informed investment decisions.
While it is not an exact science, technical analysis can be a helpful tool for identifying opportunities and managing risk and is most often used to determine when a trader should enter and exit a trade.
There are two main types of charts that technical analysts use: bar charts and line graphs. Bar charts show the opening, high, low, and closing prices for a security over a set time period, while line graphs connect the closing prices of securities over time to create a trendline. By looking at these trends, investors can get an idea of where the security might be headed in the future.
Technical analysis will never give a 100% iron clad guarantee of what a stock will do – no method or technique will ever be able to do this – but many people have found it to be very effective in helping them. Many professional traders swear by it as a very helpful tool that they’ve been able to use in order to make informed decisions about their investments.
The list of different types of technical indicators and how to use them
There are three main types of technical indicators: trend, momentum, and volume.
Trend Indicator

Trend indicators help traders identify the current direction of a security’s price movement.
This can be incredibly helpful as most trades you place generally should be in line with the overall trend of the market.
You almost always hear traders use the saying, “The trend is your friend” when it comes to placing trades that follow the current trend of the market – and this is what trend indicators try to predict.
Momentum Indicator
Momentum indicators measure the speed and magnitude of price changes over a given period of time.
In technical analysis, momentum is the rate of change in an asset’s price over time and it’s often used to identify trend reversals and to measure how strong a trend is.
Momentum is typically measured using oscillators, which are technical indicators that fluctuate between two extremes. The most common momentum indicator is the Relative Strength Index (RSI), which measures the magnitude of recent price changes to identify overbought and oversold conditions. momentum can also be measured using the theMACD (moving average convergence divergence) indicator, which plots the difference between two moving averages. Momentum is an important concept in technical analysis and can be a helpful tool for identifying trading opportunities.
Volume Indicator

Volume indicators track the number of shares or contracts traded over a given period – usually within the span of a day. It’s one of the most popular indicators used by traders to gauge market activity and potential trend direction.
When combined with price action, volume can be used to identify potential reversals, breakouts, and continuation patterns.
For example, a strong uptrend will typically see increasing volume as more investors jump on board. On the other hand, a sharp decline in volume can signal that the current trend is losing steam and may be about ready to reverse.
This is why volume can be such an important tool, as it helps confirm the likely direction of the asset.
The benefits of using technical indicators for stock market prediction
There are many benefits of using technical indicators when trading financial markets.
Here’s a list of some of the most common benefits:
- They can help you identify potential entry and exit points. This allows you to set stop-losses & take-profits because they can give you valuable insights into market trends.
- They can help you manage risk. By understanding how an indicator works, you can better determine your risk tolerance and money management strategy. This can help you avoid costly mistakes and protect your capital.
- They can help improve your trade timing & execution. By spotting certain patterns and taking action, you it can help take some of the emotion out of your trading, which ultimately helps you trade your system better.
How to create a trading strategy using technical analysis
When creating a trading strategy, the first step is to identify or develop one.
A great place to start for any novice trader is to start by using a moving average crossover strategy as a foundation or jumping off point.
Once you understand why technical analysis works as a window into market psychology and how to profit from it, you can focus on a particular trading approach and develop a disciplined strategy that you can follow without letting emotions or second-guessing get in the way.
Tips for beginners when starting out in technical analysis
Technical analysis is more than just following price charts. In order to be successful, you need to understand the indicators and signals that are being used.
Backtesting your trading strategy can help you better understand how a certain indicator or strategy would have performed in the past. This will give you an idea of whether or not the strategy is worth pursuing further.
Practicing before putting real money on the line will save you money and time in the long run! Remember to start small and expand as you gain experience …and this is a key rule for any trader, regardless of skill level.
When starting out, it’s important to get a sense of what kind of market conditions your trading strategy works well under – and always be aware of which direction the overall market is trending in.
Common mistakes made by beginners in technical analysis
There are a few common mistakes that beginners make when starting out in the technical analysis.
One of the biggest ones is not having their trading account set up properly for the security they’re trading.
Another mistake is using too many indicators on their charts, which can muddle their analysis and lead to poor decision-making.
A basic account set up with just moving averages on candlestick charts will give you a great amount of information as you get started.
Adding too many charts and indicators to your screen will over-complicate things. And when that happens, the end result is often one of you losing money.
List Resources for further learning about technical analysis
If you’re interested in learning more about technical analysis, these resources can be a great place to start:
Getting started in technical analysis by Jack Schwager

Jack Schwager is a widely respected name in the world of finance, and his book “Getting Started in Technical Analysis” is considered one of the classics.
In it, Schwager provides a step-by-step guide to understanding and using technical analysis, with a heavy emphasis on charting techniques.
While some of the book’s insights may be a little dated, it remains an essential resource for anyone interested in learning about this important field.
Among other things, Schwager covers topics such as trend lines, support and resistance levels, moving averages, and market indicators.
He also includes numerous real-world examples to illustrate key concepts.
“Getting Started in Technical Analysis” is a great addition to any trader’s bookshelf.
The Technical Analysis Guidebook: A Comprehensive Introduction to Trading Methods and Techniques by John Murphy
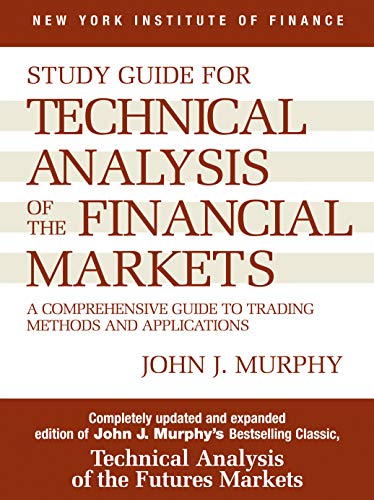
John Murphy’s “Technical Analysis Guidebook” is a comprehensive introduction to the world of technical analysis.
It’s written clearly & concisely, making it perfect for those new to the subject.
The book covers all the basics, from charting techniques to indicators, and provides clear examples to illustrate each concept. It also includes a glossary of terms, which is especially helpful.
The Encyclopedia of Chart Patterns by Thomas Bulkowski

The Encyclopedia of Chart Patterns by Thomas Bulkowski is one of the most comprehensive and user-friendly guides on chart pattern analysis that’s available today.
Covering 22 different patterns in detail, the book provides clear explanations of how to identify and trade each one.
Beyond that, Bulkowski includes extensive statistical data on the performance of each pattern, making it an invaluable resource for both experienced and novice traders alike. (This alone makes the book worth picking up!)
Knowing the statistical liklihood of a chart pattern happening really helps you focus on which set ups are best used and when.
Trading ranges: How to trade price swings using support and resistance levels by Bruce Babcock

A trading range is a period of time during which a security’s price isn’t trending up or down, but instead is moving sideways.
And as stocks tend to trade within ranges a lot, being able to spot ranges are important to technical analysts as they help to identify support and resistance levels.
A support level is a price at which there’s often been enough demand for security that it’s unlikely to fall below that price.
A resistance level, on the other hand, is a price at which there is enough selling pressure that the security is unlikely to rise above that price.
By identifying these levels, technical analysts can make better-informed decisions about when to buy and sell stocks.
That makes this book a fantastic guide for traders, as correctly identifying support & resistance levels is absolutely key when it comes to getting started in technical analysis.
FAQ
How do I start learning technical analysis?
If you're interested in learning technical analysis, there are a few things you need to know. First, you need to be familiar with basic charting techniques. This includes understanding how to read candlestick charts, as well as other types of charts such as bar charts and line charts. Second, you need to know how to identify key price levels, such as support and resistance levels. Finally, you need to understand how to use technical indicators to help you make decisions about when to buy and sell. While technical analysis can be complex, these basic concepts are a good place to start. With a little practice, you'll be on your way to becoming a technical analysis expert in no time.
Is technical analysis easy to learn?
Technical analysis can take years to learn properly but is not that difficult to pick up on your own. There are a lot of different indicators, patterns and techniques to practice, but with time & testing it can be done.
Does Warren Buffett use technical analysis?
Many successful investors have made a fortune by following the wisdom of Warren Buffett. But does the 'Oracle of Omaha' himself use technical analysis when making investment decisions? Technical analysis is a method of predicting future price movements by looking at past market data, and it is often used by day traders or other short-term investors. Buffett, on the other hand, is known for taking a long-term view, holding onto his investments for years or even decades. He has said that he doesn't pay attention to 'short-term gyrations in the market' and that kind of time frame is not conducive to using technical analysis. Therefore, it seems unlikely that Buffett uses this approach in his own investing.
Is technical analysis profitable?
Many traders believe that technical analysis is an essential tool for identifying trading opportunities and maximizing profits. While there is no guarantee that technical analysis will always be successful, many traders claim it to be a helpful tool for analyzing the markets and making informed trading decisions. By carefully studying past market data, traders can gain a better understanding of how prices are likely to move in the future. With this information, they can make more informed trading decisions and potentially increase their profits.
Can I learn technical analysis for free?
Yes, it's very possible to learn technical analysis for free. There are a variety of resources available (and many here on our site) that can help you get started with learning technical analysis.