In trading, supply and demand are everything. Prices are constantly moving up and down as buyers and sellers jostle for position. As a result, correctly identifying areas of supply and demand is critical for any trader looking to make a profit. Fortunately, there is a tool that can help traders quickly and easily identify areas of supply and demand. It’s called the Supply and Demand Indicator (S&D Indicator).
By using this indicator, you will be able to see areas where there is a lot of buying or selling pressure. This can help you make better trading decisions.
What is the Supply and Demand Indicator?
The Supply and Demand Indicator is a technical tool that can be used by traders to help identify potential trading opportunities in the market. The indicator measures the relationship between the supply and demand of security and can be used to identify areas where the market is either overbought or oversold. The indicator is calculated by taking the difference between the number of advancing and declining stocks and then dividing it by the total number of stocks traded. A reading above 100 indicates an overbought market, while a reading below -100 indicates an oversold market.
This can be a useful tool for traders as it can help them identify potential trading opportunities in the market. However, it is important to note that the indicator should not be used in isolation, but rather as part of a broader technical analysis strategy.
How Does the Supply and Demand Indicator Work?
In order to better understand how the stock market works, it is important to have a grasp on the basic laws of supply and demand. The same principles that apply to everyday commodities also apply to stocks and other securities. When there is more demand for a product than there is available supply, the price of the product goes up. The opposite happens when there is more supply than demand.
The amount of available stock for a company is determined by its shareholders. When a company first goes public, its shares are bought up by investors who believe in the long-term potential of the business. As the company grows and becomes more profitable, more and more people want to own shares of that company. This increases the demand for the stock, which drives up its price.
The interpretation of the indicator is fairly simple. If the indicator is positive, it means that there is more buying pressure than selling pressure, and vice versa. A reading of 0 indicates that there is equal buying and selling pressure.
The indicator uses four patterns – rally base rally, drop base drop, rally base drop, and drop base drop – to create the supply and demand zones. The supply and demand zone indicator is a reliable indicator of equilibrium in the market. Traders can use the supply and demand zone indicator to make profitable trades.
The Four Patterns of Demand and Supply Zone Indicator
There are four distinct patterns that the Demand and Supply Zone Indicator can display. These patterns are the following:
Rally Base Rally
Rally Base Rally is a supply and demand indicator that uses price and volume action to identify potential reversals in the market. The indicator consists of two parts: the rally baseline and the rally base signal line. The rally baseline is created by taking the average of the high and low prices for a specified period of time. The rally base signal line is created by taking the average of the volume for a specified period of time.
When the market is in an uptrend, the rally baseline will be above the rally base signal line. This indicates that there is more buying than selling pressure in the market and that prices are likely to continue to move higher. Conversely, when the market is in a downtrend, the rally baseline will be below the rally base signal line.
Drop Base Drop
A Drop Base Drop (DBD) is a pattern that can be found in the supply and demand indicator. This pattern can be used to help identify potential turning points in the market. The DBD consists of three consecutive price drops, followed by a base formation. This base can be either a consolidation period or a reversal candlestick pattern. The DBD is a bearish pattern and should be treated as such.
Rally Base Drop
In technical analysis, the base drop pattern is a bearish signal that occurs when demand starts to fall and there is a consequent decrease in price. This pattern is created by a series of lower highs and lower lows. To confirm the base drop pattern, the volume should also be decreasing as the price falls. When this pattern occurs in an uptrend, it is often a sign that the trend is about to reverse.
Drop Base Rally
The Drop Base Rally pattern is a popular supply and demand indicator used by many traders. This pattern is created when the price of a security drops sharply and then rallies back to the original level. The Drop Base Rally pattern is considered to be a bullish signal, as it indicates that there is strong buying pressure at the lower prices.
Why Should You Use the Supply and Demand Zones Indicator?
The Supply and Demand Zones Indicator is a powerful tool that can help you make better trading decisions. Here are three reasons why you should use this indicator:
1. It can help you find high-probability trade setups
The Supply and Demand Zones Indicator can help you identify potential trade setups by showing you areas of supply and demand. These areas are where buyers and sellers are most likely to enter the market, so finding trades in these zones can give you a better chance of success.
2. It can help you manage your risk
By knowing where potential trade entries are, you can better manage your risk by placing your stop loss orders outside of these zones. This way, if the market does not move in your favor, you will still be able to exit your position with a smaller loss.
3. It can help you manage your position size
The Supply and Demand Zones Indicator will also show you the number of shares that are traded in each zone. This means you can use the numbers to help decide on a position size that’s appropriate for your trading account.

What are the Drawbacks of Using the Supply and Demand Indicator in Trading?
The supply and demand indicator is a popular tool among traders, but there are some drawbacks to using it. First, the indicator only works well in markets that are in equilibrium. That means that if there is an imbalance in supply and demand, the indicator will not be accurate. Second, the indicator can only be used to predict short-term changes in price. It is not effective for predicting long-term trends. Finally, the indicator is subject to interpretation. What one trader might see as a buy signal, another might see as a sell signal. This can lead to confusion and conflict among traders who are using the same indicator.
How to Choose the Best Supply and Demand Indicator?
When it comes to trading, one of the most important things to know is how to identify key supply and demand areas in the market. This will allow you to make better-informed trading decisions and improve your overall results.
So, what is the best way to choose a supply and demand indicator? Here are a few tips:
- Look for an indicator that is easy to interpret. You don’t want something that is too complicated or difficult to understand.
- Make sure the indicator gives clear and concise signals. You don’t want something that generates a lot of false signals or is hard to read.
- Choose an indicator that is suitable for your trading style. If you are a day trader, you will need a different indicator than someone who trades weekly charts.
- Choose a supply and demand indicator that is easy to use with your trading platform. If you are using a broker with proprietary software, you can find some indicators that work well with their platforms.
- Look for an indicator that is accurate over the long term.

What are the Best Supply and Demand Indicators
Traders apply technical indicators to have a better understanding of the psychology of the market and the supply and demand for assets. These signs work together to form the core of technical analysis.
Moving Average Convergence Divergence (MACD)
The MACD is a trend-following momentum indicator that shows the relationship between two moving averages of prices. The indicator was developed by Gerald Appel in the late 1970s and has since become one of the most popular technical indicators used by traders.
The indicator is created by subtracting the 26-day exponential moving average (EMA) from the 12-day EMA. The resulting line is then plotted on a separate graph, which is used to help identify trend changes. MACD signals can be used to identify both bullish and bearish market conditions. A bullish signal occurs when the MACD line crosses above the signal line, while a bearish signal occurs when the MACD line crosses below the signal line. MACD divergences are also useful in identifying potential trend reversals. A bullish divergence occurs when the MACD line forms higher lows while prices are forming lower lows. This indicates that momentum is starting to shift back in favor of the bulls.
Relative Strength Index
The Relative Strength Index (RSI) is a technical indicator used in the analysis of financial markets. It is used to measure the strength of a stock or market relative to other stocks or markets. The RSI is calculated using a simple mathematical formula that takes into account the closing prices of a stock or market over a given period of time. The resulting number is then plotted on a scale from 0 to 100.
Generally, if the RSI is above 70, it is considered to be overbought, and if it is below 30, it is considered to be oversold. However, these levels can vary depending on the specific stock or market being analyzed. The RSI can be used as a standalone indicator or in conjunction with other technical indicators to provide further confirmation of trading signals.
Stochastic Oscillator
The stochastic oscillator is a momentum indicator that is widely used in the field of technical analysis. It is created by taking the difference between the closing price and the low price over a given period of time. The resulting number is then plotted on a scale from 0 to 100. A reading above 80 indicates that the security is overbought, and a reading below 20 indicates that it is oversold.
The stochastic oscillator can be used to signal when security is ripe for buying or selling. For example, if the indicator readings are consistently above 80, it may be time to sell. On the other hand, if readings are consistently below 20, it may be time to buy. The key to using this indicator is to look for instances where readings move from one extreme to another. These signals can be used as confirmation when making trading decisions.
Aroon Indicator
Aroon Indicator is an important technical analysis tool that can be used to identify trend direction and strength. The Aroon indicator is composed of two lines, the Aroon Up line and the Aroon Down line. These lines help to identify trends by measuring the number of periods since price highs and lows. The Aroon Up line is plotted using a formula that measures the number of periods since the most recent price high, while the Aroon Down line is plotted using a formula that measures the number of periods since the most recent price low. If the Aroon Up line is above the Aroon Down line, it indicates that prices are in an uptrend. If the Aroon Down line is above the Aroon Up line, it indicates that prices are in a downtrend.
Average Directional Index
The Average Directional Index is a technical indicator that measures the strength of a trend. The ADX is calculated using a moving average of price range expansion over a given period of time. The resulting number is plotted on a scale from 0 to 100, with readings below 20 indicating a weak trend, and readings above 50 indicating a strong trend.
The ADX can be used to identify both rising and falling trends, as well as to gauge the strength of those trends. In general, the ADX is most useful when combined with other technical indicators, such as support and resistance levels or Fibonacci retracement levels. While the ADX is a helpful tool for identifying trends, it should not be used alone; instead, it should be used in conjunction with other technical indicators to provide a more complete picture of market conditions.
The Best Tools for Trading
cTrader Supply & Demand Zones
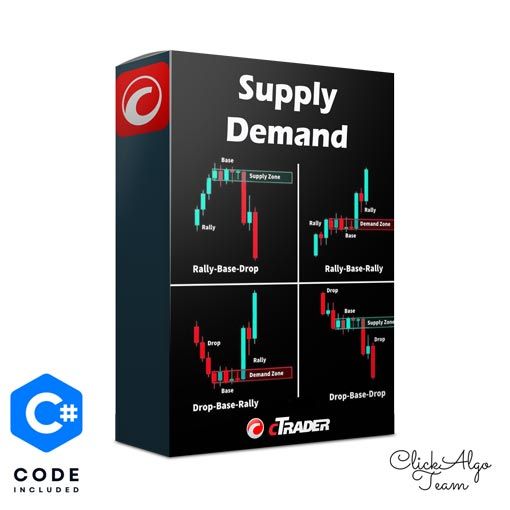
When trading the financial markets, it is important to be able to identify key areas of support and resistance. These areas are where the market is most likely to reverse direction and can provide traders with an excellent opportunity to enter or exit a trade. The cTrader platform provides users with a number of tools that can be used to help identify these key areas, one of which is the Supply & Demand Zones indicator.
The Supply & Demand Zones indicator highlights areas on the chart where there has been a significant amount of buying or selling activity. These zones are typically where the market will reverse direction, making them an excellent place for traders to enter or exit a trade. The indicator can be used in any time frame and will automatically adjust itself based on the current price action.
Tradingview
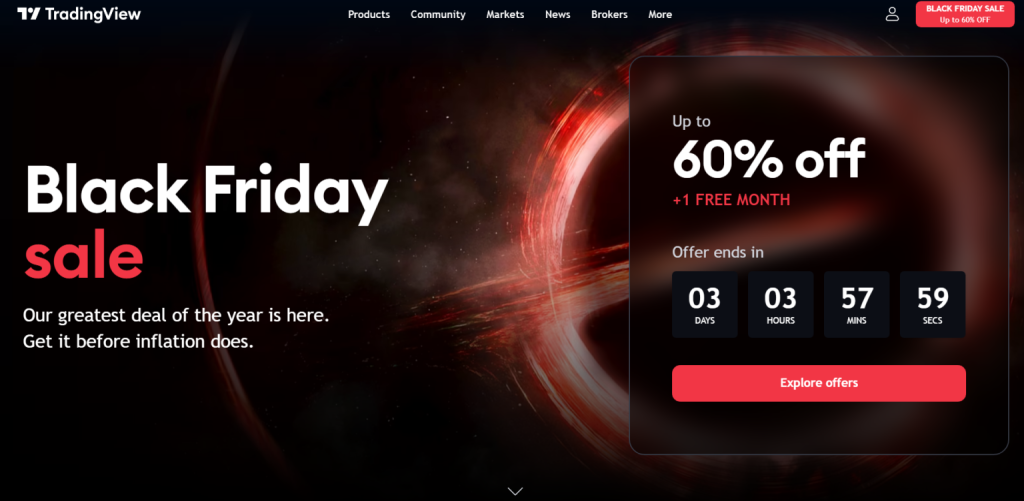
The TradingView Supply and Demand Indicator is a powerful tool that can help you find profitable trading opportunities. By identifying areas of high supply and demand, you can enter and exit trades with confidence, knowing that there is strong buying or selling pressure behind the move. This indicator is easy to use and can be a valuable addition to your technical analysis arsenal.
Patternalpha
The Patternalpha supply and demand indicator is a technical tool that can be used to identify potential areas of support and resistance in the market. The indicator is based on the concept of price action, which states that prices move in cycles. The Patternalpha supply and demand indicator uses this concept to identify potential areas where prices may reverse.
Trendspider
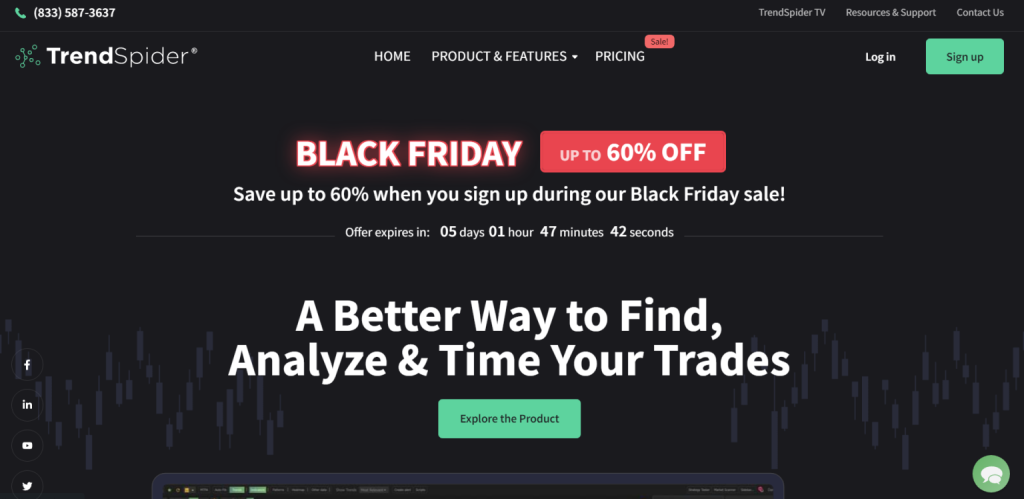
The Trendspider supply and demand indicator is a powerful tool that can help traders find profitable trading opportunities. The indicator works by identifying areas of high supply and low demand, which can lead to prices moving in the opposite direction. This makes it an ideal tool for finding reversals and breakouts. The Trendspider indicator is available for both MetaTrader 4 and NinjaTrader 7.
Frequently Asked Questions
Is supply and demand a good strategy for trading?
Supply and demand is one of the most basic economic concepts and it can also be a powerful tool for traders. By understanding how supply and demand affect prices, traders can make better decisions about when to buy and sell.
However, there are also some risks associated with trading on supply and demand. If a trader doesn’t have a good understanding of the underlying factors that drive prices, they could end up making bad trades. Overall, supply and demand can be useful strategies for traders if used correctly. However, like any other trading strategy, it’s important to understand the risks involved before using it.
How do you analyze demand and supply?
In trading, demand and supply analysis is the process of trying to predict future changes in price by studying the interaction between traders and recent price action. By understanding how traders buy and sell at different prices, it’s possible to get a sense for where the market might be headed next.
One way to analyze demand and supply is through order flow. This looks at the volume of trades being made at different prices to try and gauge whether buyers or sellers are in control. If there’s more buying than selling, then prices are likely to go up as demand outweighs supply. Conversely, if there’s more selling than buying, then prices are likely to fall as supply exceeds demand. Another way to analyze demand and supply is through support and resistance levels. This looks at past levels where price has bounced off of. If there’s a surge in demand, then prices will break through resistance levels and keep going up. On the flip side, if there’s a sudden drop in demand, then prices will break down through support levels and keep heading lower.
Which indicator is best for supply and demand?

When it comes to trading, there are a lot of different indicators that can be used in order to make informed decisions. However, when it comes to supply and demand to trade, not all indicators are created equal. So, which one is the best?
Well, that really depends on what you’re looking for. If you’re just starting out, then the moving average convergence divergence (MACD) might be a good option. This indicator measures the difference between two exponential moving averages and is often used to identify trend reversals. Another popular option is the relative strength index (RSI). This indicator measures the speed and change of price movements and can be used to identify overbought or oversold conditions. Ultimately, it’s up to you to decide which indicator works best for your trading style and goals.
Which indicator has the highest accuracy?
The answer may surprise you – it’s not necessarily the most popular indicators that have the highest accuracy. In fact, many of the best traders keep their methods and indicators secret, because they know that if everyone is using the same tools, they will all be competing on a level playing field.
So which indicator has the highest accuracy? It depends on who you ask – but there are a few that consistently come up as favorites. The Relative Strength Index (RSI) is a popular choice, as it can be used to measure both overbought and oversold conditions in the market. Another favorite is the Moving Average Convergence Divergence (MACD), which is a trend-following indicator that can help you spot market reversals. Whichever indicator you choose, remember that no tool is 100% accurate all the time.
How do you identify a strong supply and demand zone?
There are a few ways to identify a strong supply and demand zone. One is to look for a area where the price has been bouncing off of support and resistance levels. Another way to identify a strong supply and demand zone is to look at the order book. If there is a large volume of orders near the current price, it is likely that there is a strong supply or demand zone nearby. Finally, you can also use technical indicators to help identify potential areas of support and resistance.
 Candlestick Scanner MT4: How Does It Work & Does It Help?
  Learn How to Day Trade for Beginners – What You Need To Know Before Trading
  No Loss Grid Trading – The Safest and Most Profitable Trading Strategy?
  Getting Started With Tick Scalping & Tick Chart Trading
  Shark Fin Trading Indicator: Here’s How to Discover This Harmonic Trading Pattern
  The Double Edge Sword of Leverage : How Is Leverage Calculated in Finance?