Here is a collection of chart patterns that have a historical pattern of being bullish.
Click here to go to the list of Bearish Chart Patterns.
Pennant Pattern
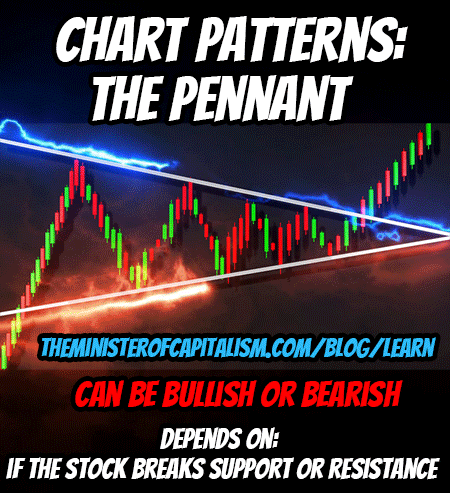
A pennant pattern is a technical analysis pattern that suggests a trend has stopped and is in a consolidation phase.
This can be either bullish or bearish, depending on it’s relation to the flag pole.
For it to be identified correctly, you have to identify the flag pole before the consolidation phase.
The flag pole is the rapid rise or fall of prices at the beginning of the consolidation phase.
A new trend is often established if the stock breaks upward through the top resistance line (signalling a bullish pattern), or breaks down through the support line (signalling a bearish pattern).
The pennant pattern gets its name from the resemblance of its shape to a flag planted on a hilltop. The Pennant formation typically forms after an extended move in one direction, and indicates that the preceding move has exhausted most of its momentum.
Cup and Handle
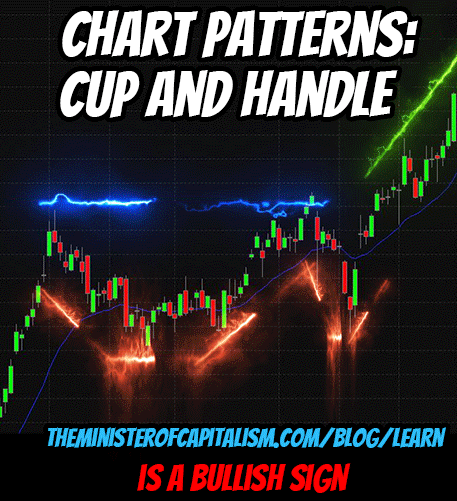
A cup and handle pattern is a bullish indicator seen within certain time frames on price charts. It can be used as a forecaster for whether the stock’s trend will continue or reverse itself. This pattern looks like a shallow “U” shape with one low point, called the “cup” and a second, higher point called the “handle.”
The pattern’s right-hand side of the decreasing handle typically has lower trading volume, before volume picks up and the pattern reverses as it tests the upper resistance line to attempt a break out to a higher price.
Triple Bottom
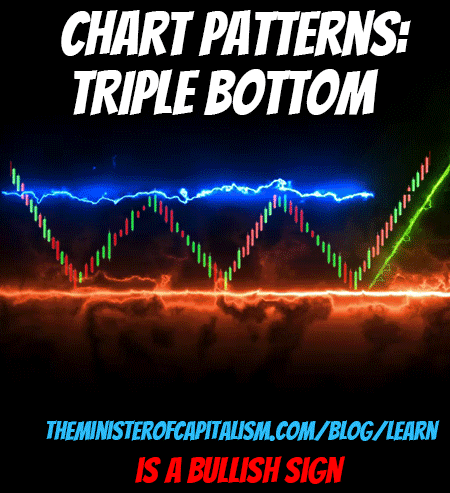
Triple bottom shows up as roughly equal lows that bounce off support & then price action pushing the stock up through resistance.
The triple bottom is seen as a signal the bulls taking over.
The Bull Flag
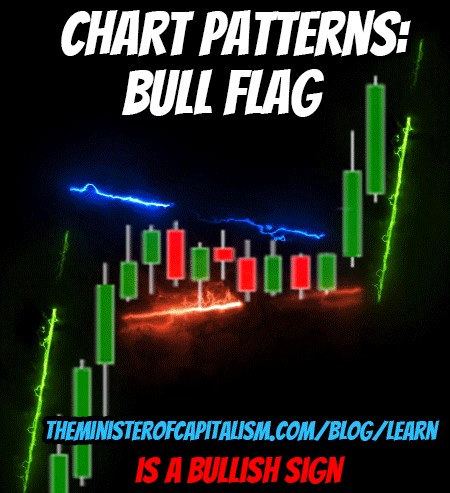 Found in stocks with strong uptrends. Considered good continuation patterns. The pole is the vertical rise in a stock & the flag is from consolidation.
Bullish Engulfing Pattern
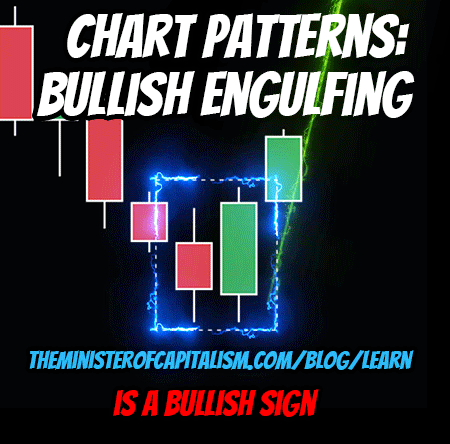
Often comes after 4 or more bearish candlesticks at the bottom of a downtrend where a new candlestick opens lower than the previous days’ low & moves up and past the previous candlestick, completely engulfing the previous bearish stick.
Inverse Head & Shoulders
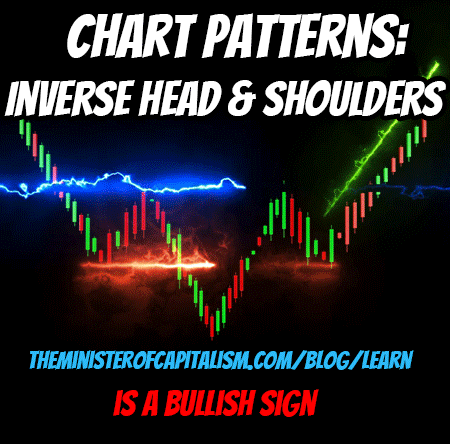
Develops after extended downtrend. Head section falls further below support level of both shoulders & breaks resistance at base of the shoulders.
Bullish Engulfing Pattern
Often comes after 4 or more bearish candlesticks at the bottom of a downtrend where a new candlestick opens lower than the previous days’ low & moves up and past the previous candlestick, completely engulfing the previous bearish stick.
Double Bottom Reversal
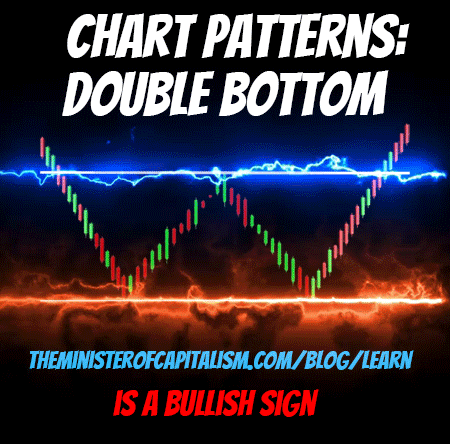
The Double Bottom reversal forms a “W” pattern, having bounced off a previous level of support twice. It always comes after a downtrend and signals a shift into a potential uptrend.
Ascending Triangle
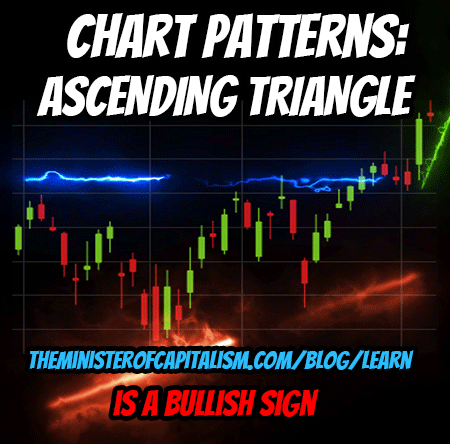
Comes as an uptrend where lows are increasing. Bounces off resistance while making higher lows before breaking out higher. Watch for increased volume when trying to break resistance.
Get Hedge Find Beating Options Trades Delivered to Your Inbox!
Tired of missing out on the huge gains in the market?
Wishing you knew which trades had the best odds of succeeding?
Would you like to know EXACTLY how & which trades to place WITHOUT having to spend years learning?
Well now you can let our Team of Trading Experts & Exclusive AI Trading Software do the work for you!
Click Here to Start Making Bank With Our Option Trade Alerts!
PS – Our trades have an average win rate around 94% and have returned QUADRUPLE digit yearly returns.