Here is a collection of chart patterns that have a historical pattern of being bearish.
Click here to go to the list of Bullish Chart Patterns.
Pennant Pattern
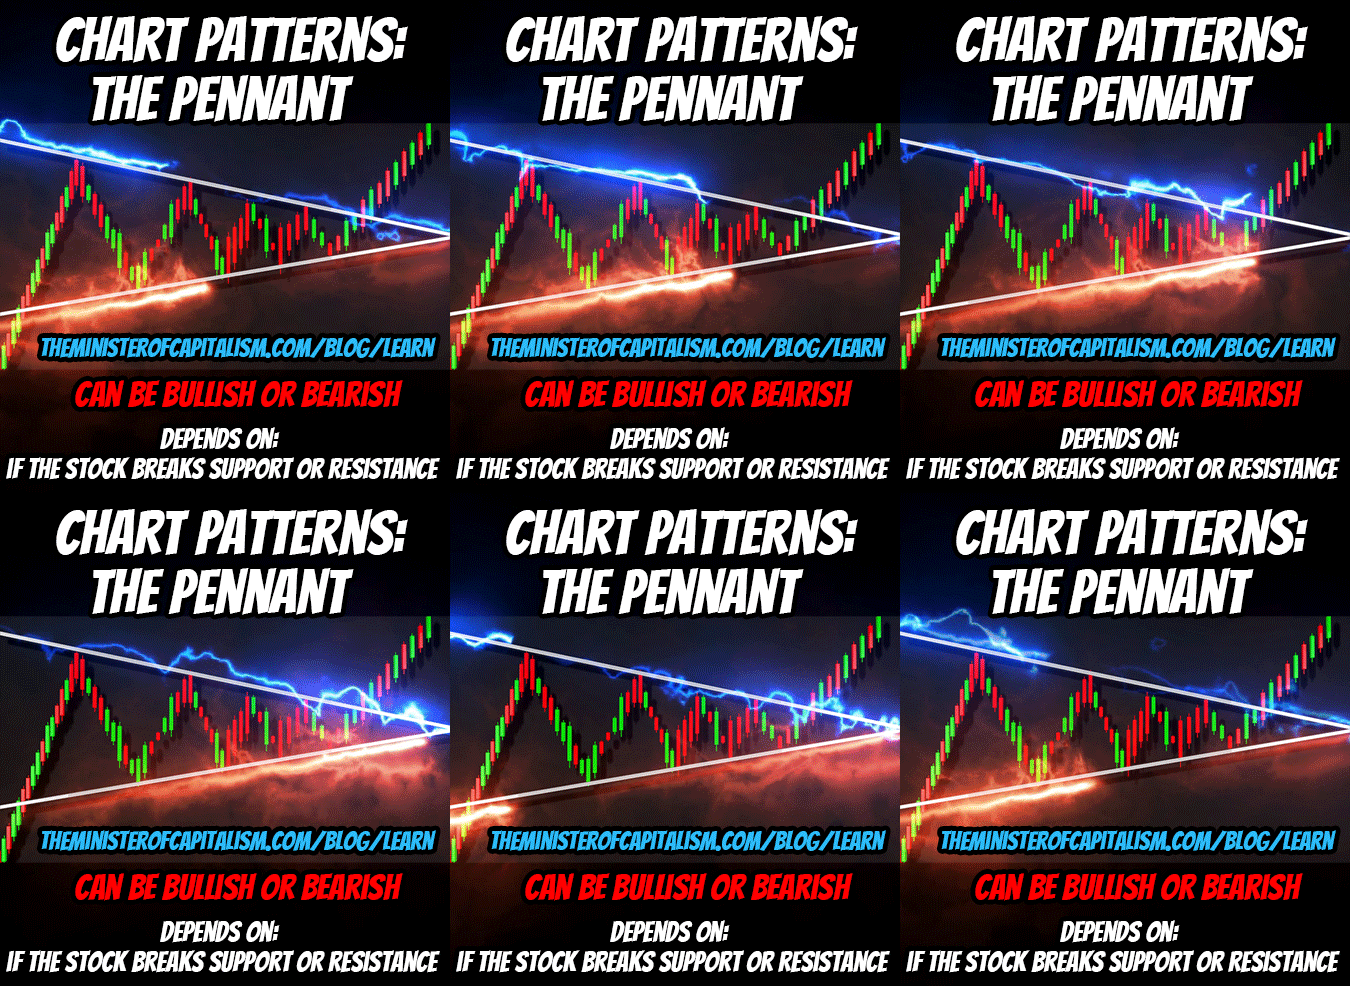
A pennant pattern is a technical analysis pattern that suggests a trend has stopped and is in a consolidation phase.
This can be either bullish or bearish, depending on it’s relation to the flag pole.
For it to be identified correctly, you have to identify the flag pole before the consolidation phase.
The flag pole is the rapid rise or fall of prices at the beginning of the consolidation phase.
A new trend is often established if the stock breaks upward through the top resistance line (signalling a bullish pattern), or breaks down through the support line (signalling a bearish pattern).
The pennant pattern gets its name from the resemblance of its shape to a flag planted on a hilltop. The Pennant formation typically forms after an extended move in one direction, and indicates that the preceding move has exhausted most of its momentum.
Double Top Reversal
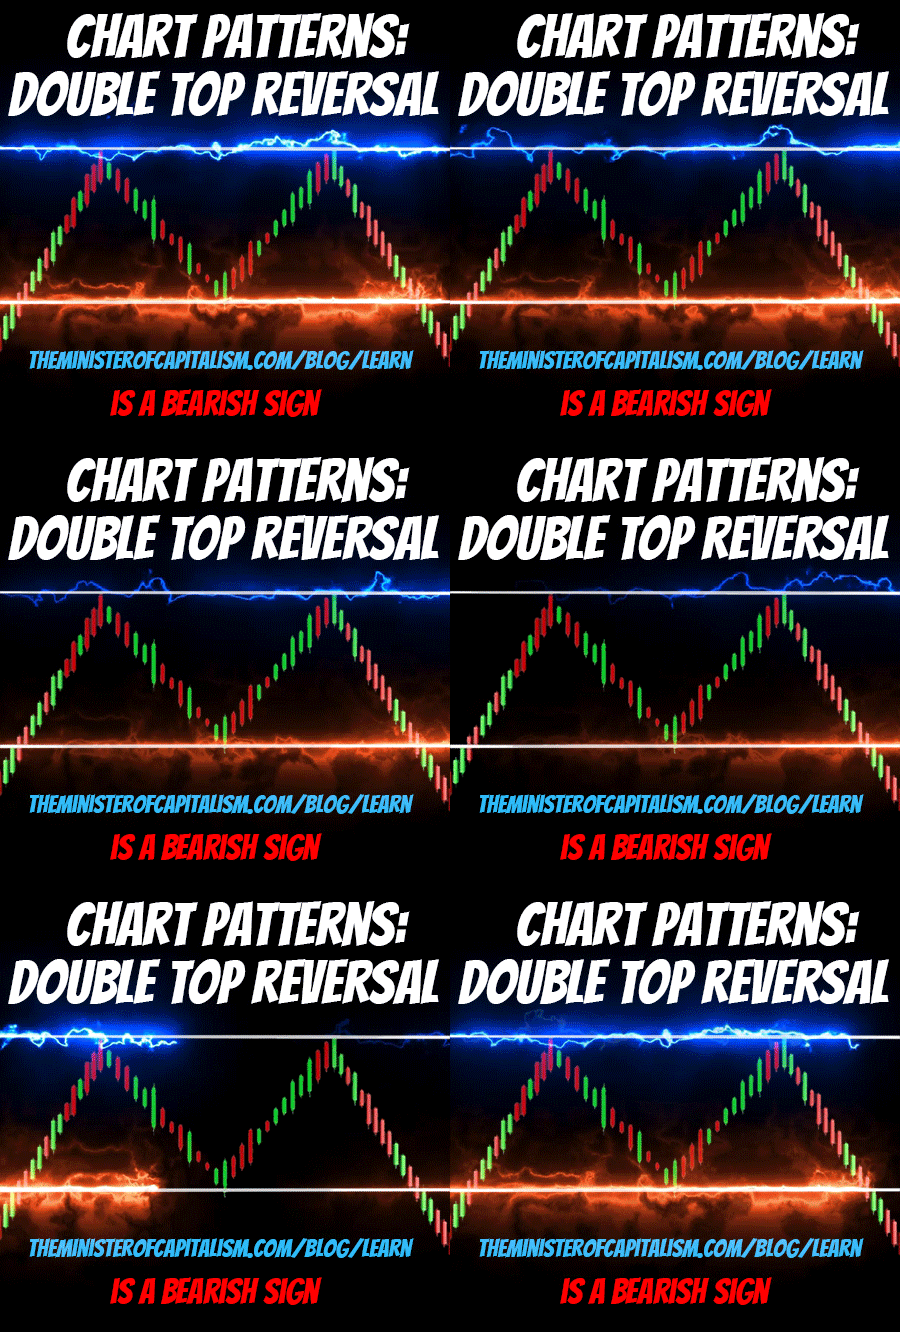
The Double Top shows two peaks with a trough in between them. The second sell off is sharp and drops down through previous support levels. This is seen as a long term trend reversal.
Triple Top

Triple tops must occur after an uptrend to predict the reversal in the movement of an asset’s price. It has 3 peaks & signals that the asset may no longer be rallying, and lower prices may be coming.
Death Cross
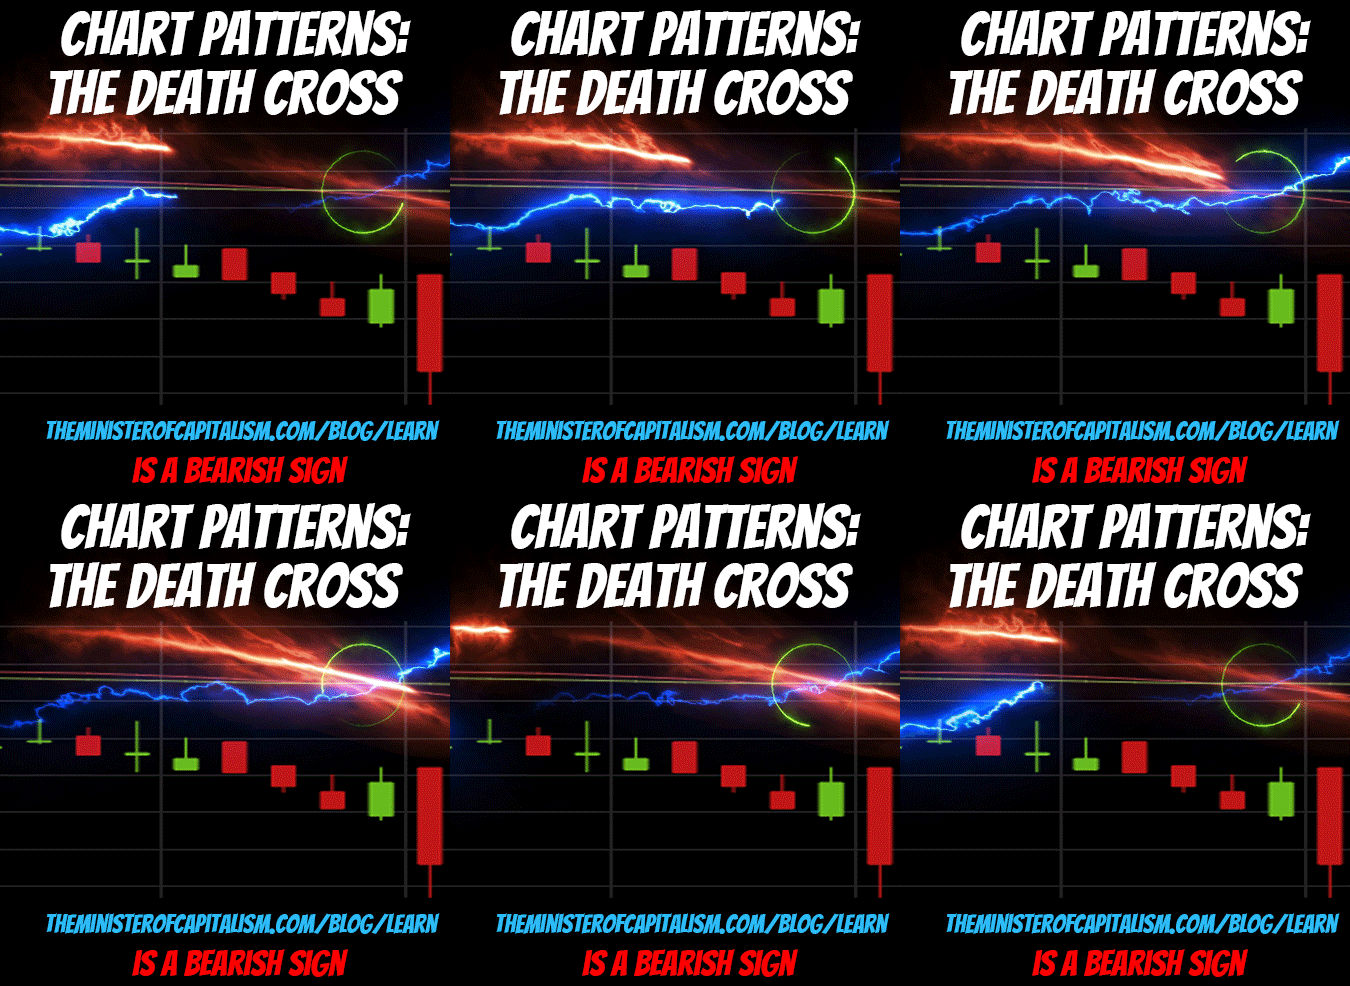
The Death Cross typically shows up when the 50 day average crosses below the 200 day moving average. This is seen as a very bearish signal.
Inverted Cup and Handle Pattern

Inverted cup and handle patterns are extremely common in the markets. These formations have a large crescent-shaped decline followed by an upward movement that slows down or pauses at about halfway through its lifespan before reversing direction again for another round of selling pressure, dropping below previous support levels.
Bear Flag Pattern
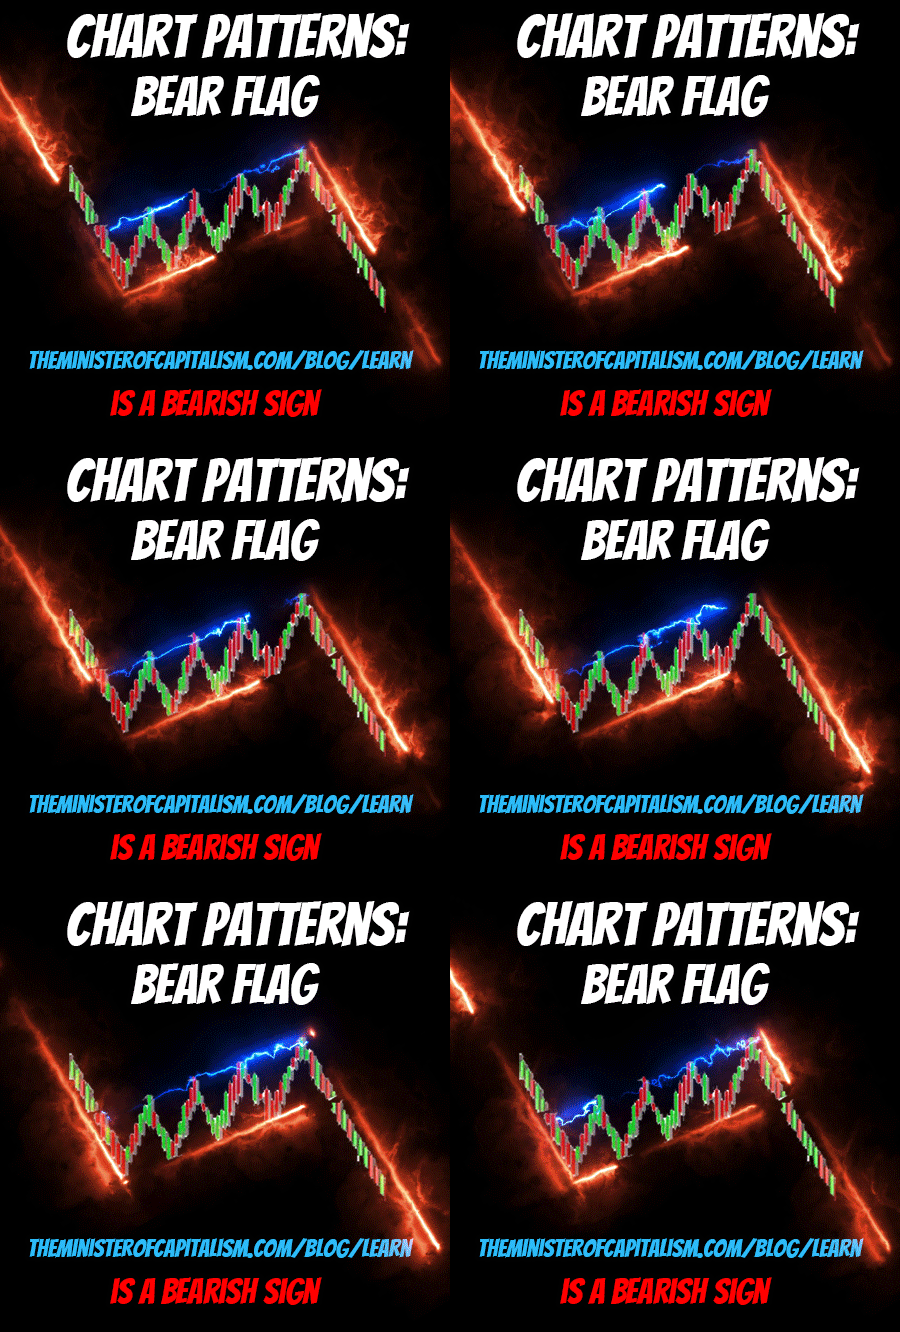
Follows a strong downward move forming the flagpole. Consolidates in a parallel range sloping upwards before breaking down back through support.
Descending Triangle Pattern
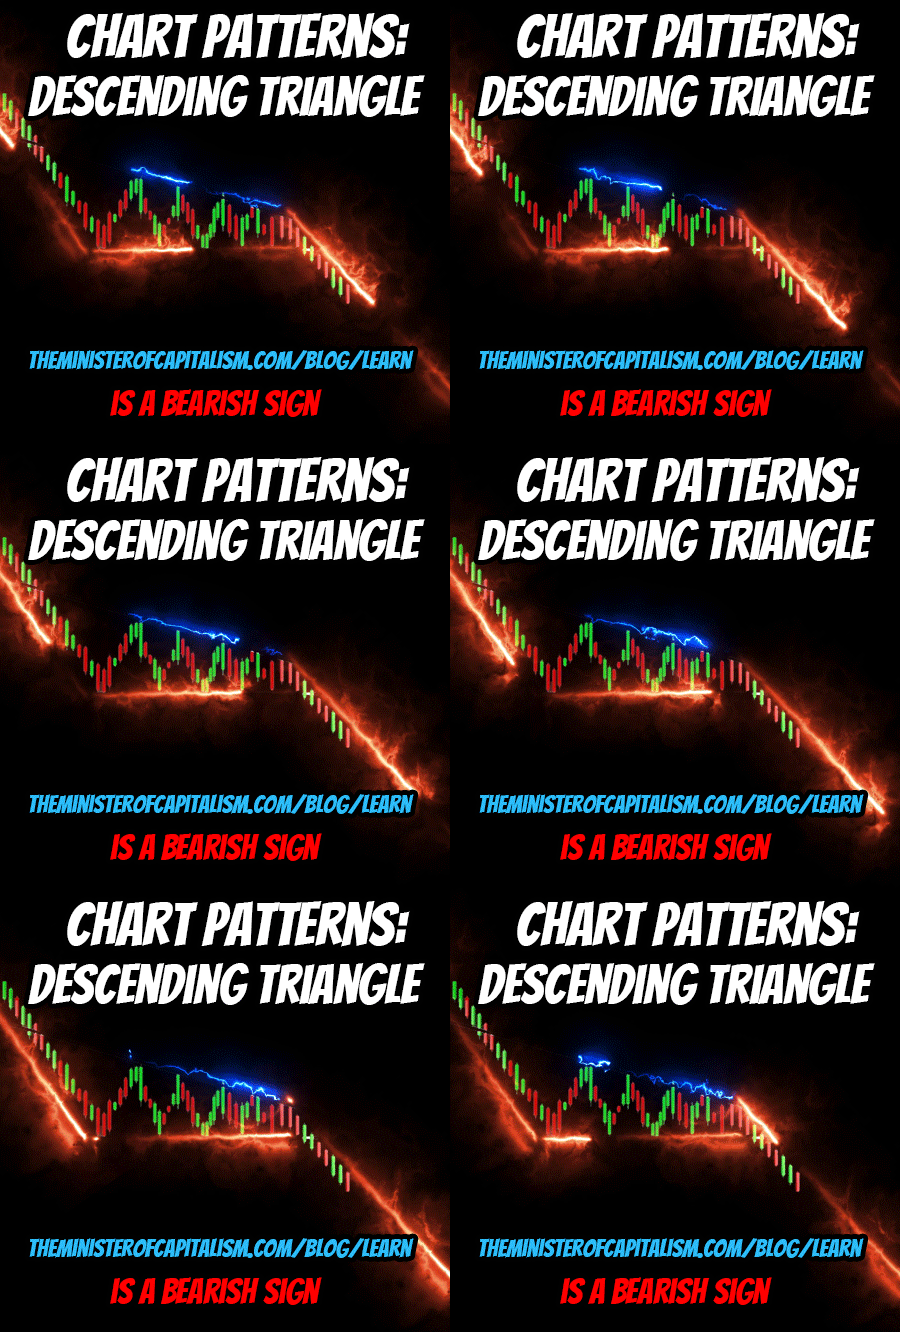
Develops after downtrend as consolidation. Has a flat support level and descending resistance line before falling below the support line to continue the downward trend.
Head & Shoulders Pattern
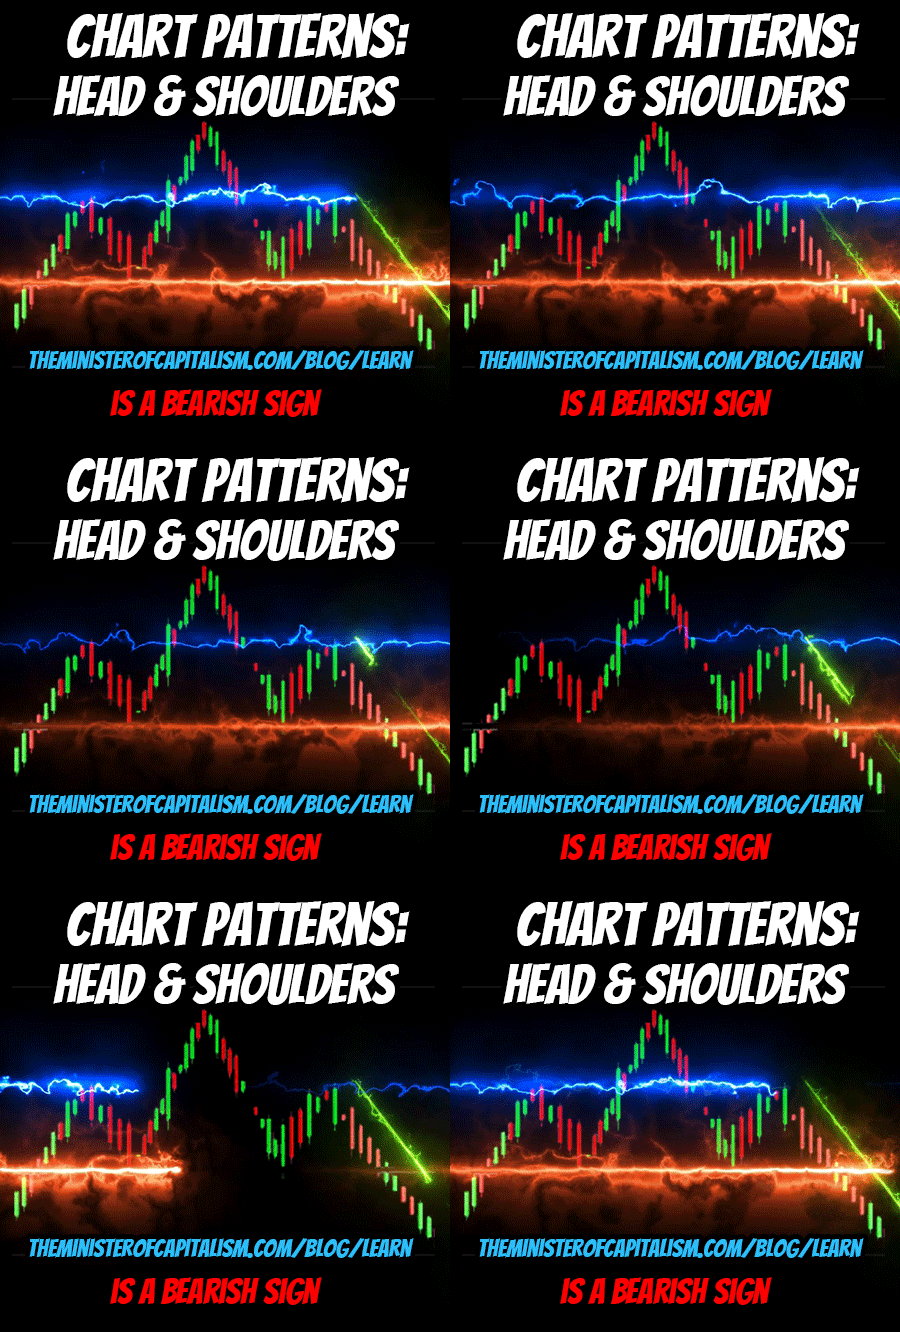
Comes after long bullish trends. Price forms three distinct peaks. The second one is higher than the other two and then drops down through the support level (called the neckline).
Get Hedge Find Beating Options Trades Delivered to Your Inbox!
Tired of missing out on the huge gains in the market?
Wishing you knew which trades had the best odds of succeeding?
Would you like to know EXACTLY how & which trades to place WITHOUT having to spend years learning?
Well now you can let our Team of Trading Experts & Exclusive AI Trading Software do the work for you!
Click Here to Start Making Bank With Our Option Trade Alerts!
PS – Our trades have an average win rate around 94% and have returned QUADRUPLE digit yearly returns.