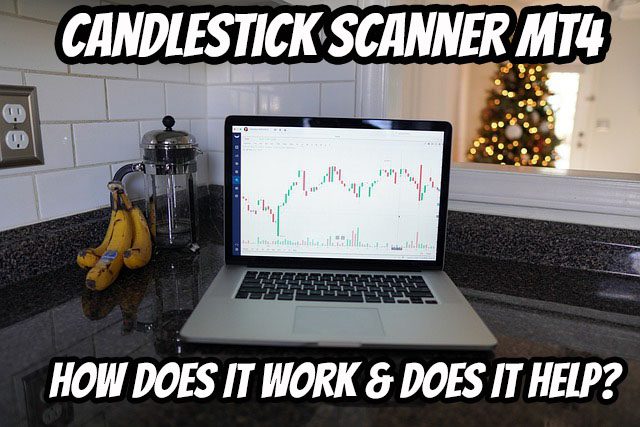
 Candlestick patterns are one of the most important tools in a technical trader’s toolbox. Candlesticks provide a way to visualize price action and potential reversals, and the Candlestick Pattern Scanner MT4 is a powerful tool that can help you find these patterns quickly and easily. In this article, we will discuss what the Candlestick Pattern Scanner is, how it works, and why it is such an important tool for technical traders.
What is a Candlestick Patterns Scanner?
Candlestick pattern scanners are tools used by traders to help identify potential trading opportunities. Candlestick patterns are created when the price of a security moves in a certain way. These patterns can be used to predict future price movements and help traders make better-informed trading decisions.
There are many different candlestick pattern scanners available, each with its own set of features and capabilities. Some scanners are designed to scan for specific patterns while others are more general purpose. No matter what type of scanner you use, they all share one common goal: to help you find potential trading opportunities and typically show candlestick patterns on your trading screen in real time.
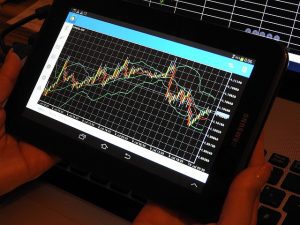 What are MT4 Candlestick Pattern Indicators
MT4 Candlestick Patterns Indicator enables you quickly find the most common candlestick patterns and trade in the direction of where these patterns tend to lead. Some patterns show the currently ongoing trend reversal, while others are simply indications that the trend will continue. (For more on each pattern, see our section on getting started in technical analysis here.)
How to Interpret the MT4 Chart Pattern Indicator?
If you a newbie when it comes to forex trading, then maybe you haven’t heard of the MT4 chart pattern indicator before & maybe you’re wondering what this indicator is and how it might help you trade.
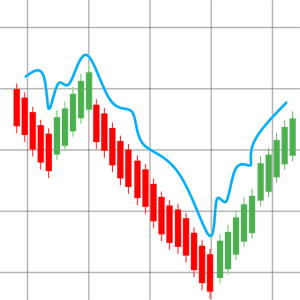
First of all, let me tell you that the MT4 chart pattern indicator is a very useful tool that can help you in your trade analysis. This indicator is available on the MetaTrader 4 platform and it automatically recognizes and draws support and resistance levels on your charts.
As a generic strategy, if you see that the price is bouncing off the support level, then it means that there is buying interest at that level. Similarly, if the price is bouncing off the resistance level, then it means that there is selling interest at that level.
Aside from that, you will need to fully understand each trading pattern and what it indicates in order to be able to know what the scanner is actually showing you.
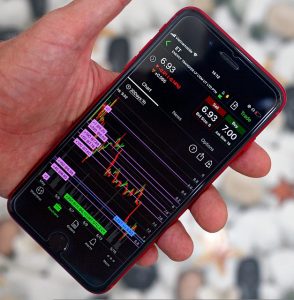
 How to Trade Using MT4 Candlestick Patterns Indicator?
Every trade should have a plan and every trader should know the ins and outs of their chosen market. This is especially true for those who trade using the MT4 candlestick patterns indicator. Here are a few tips on how to use this powerful tool to your advantage.
When trading with the MT4 candlestick patterns indicator, it is important to remember that this tool is only one part of your overall strategy. Candlestick patterns can be helpful in identifying potential entry and exit points, but they should not be relied upon exclusively. In addition to using candlestick patterns, it is also important to consider other technical indicators, as well as fundamental factors when making trading decisions.
One of the most important things to remember when using the MT4 candlestick patterns indicator is that no single pattern is 100% reliable.
A List of Some Common Candlestick Patterns
There are numerous candlestick patterns that can be used to signal future price movements.
The following list is the most commonly used and reliable patterns:
 Morning and Evening Star
The Morning and Evening Star candlestick patterns are among the most important reversal patterns in technical analysis. They are composed of three candles, with the first and third being small bodies and the second being long bodies. The pattern gets its name from the fact that it resembles a star shining in the sky.
The Morning Star pattern occurs at the end of a downtrend and signals a potential reversal to the upside. The first candle is a small body candle that closes near the bottom of the candlestick. The second candle is a long body candle that closes near the top of the candlestick. The third candle is another small body candle that closes near the bottom of the candlestick. The Evening Star pattern occurs at the end of an uptrend and signals a potential reversal to the downside.
Piercing
Piercing in candlestick patterns refers to a bullish reversal pattern that forms after a period of the downtrend. The pattern is created when the candlestick opens below the previous day’s close and then closes above the previous day’s open. This candlestick is said to pierce through the previous day’s body, hence its name.
The piercing pattern is a significant reversal signal because it shows that the bulls are starting to regain control of the market after a period of bearishness. This pattern can be used as a trade entry signal, with traders buying when the candlestick closes above the previous day’s open. Stop-loss orders should be placed just below the low of the piercing candlestick.
 Dark Cloud
The candlestick pattern known as Dark Cloud Cover is a bearish signal that occurs at the top of an uptrend. It is created when the candle for the current day closes below the midpoint of the previous day’s candle. The name “Dark Cloud” comes from the fact that the candlestick pattern looks like a dark cloud that is about to cover up the sun.
The Dark Cloud Cover pattern is considered to be a very reliable bearish signal, and it can be used to predict a reversal in the direction of the trend. This pattern is often found at market tops, and it can be used as a signal to sell or short stocks.
Three White Soldiers
There are a few different interpretations of Three White Soldiers candlestick patterns, but the most common one is that it’s a bullish signal. This pattern consists of three consecutive white candlesticks with higher closes. Each candle should have a small body with no or very little overlap with the previous candle. The pattern is considered complete when the third candle closes above the midpoint of the first candle.
The Three White Soldiers is seen as a bullish reversal pattern, typically occurring after a prolonged downtrend. It’s thought to be a sign that buyers are finally gaining control and that prices are likely to continue moving higher from here.
 Three Black Crows
In candlestick patterns, Three Black Crows is a bearish reversal pattern that consists of three consecutive black candlesticks with declining opens and closes. Each candle should have a lower close than the previous candle’s close, and the bodies of the candles should be relatively short. Three Black Crows is considered a more reliable signal in an uptrend than in a downtrend.
Hammer
In candlestick charting, a hammer occurs when the open, high, and close are roughly the same price. The low is significantly lower than the other three prices. The long lower shadow indicates that sellers tried to push prices lower but buyers came in and eventually pushed prices back up to where they had opened. A hammer is a bullish signal and suggests that prices will move higher.
Shooting Star
A shooting star is a bearish reversal signal that comes after an uptrend. It is created when the open, low, and close are all within the upper half of the candlestick and there is a long wick extending below the body. The long wick indicates that there was significant selling pressure during the period which pushed prices lower. The shooting star signals that the bulls are losing control and that prices are likely to head lower in the future.
 Bullish and Bearish Engulfing
A bullish engulfing pattern is a candlestick chart pattern that forms when a small black candlestick is followed by a large white candlestick. This pattern indicates that the bears are losing control and the bulls are taking over.
A bearish engulfing pattern is the opposite of a bullish engulfing pattern, forming when a small white candlestick is followed by a large black candlestick. This pattern indicates that the bulls are losing control and the bears are taking over.
Rising and Falling Three
The candlestick pattern known as Rising and Falling Three is one of the most important and reliable patterns in technical analysis. The pattern consists of three consecutive candlesticks, each with a higher high and lower low than the previous one. The first candle is white or green, while the second and third candles are black or red.
The key to interpreting this pattern is to look at the direction of the trend prior to the formation of the pattern. If the trend was down beforehand, then the Rising and Falling Three pattern is bearish and indicates that prices are likely to continue falling. On the other hand, if the trend was up beforehand, then this pattern is bullish and suggests that prices are likely to continue rising. This pattern is considered fairly reliable, especially when it appears after a prolonged trend in either direction.
 Inside Up and Inside Down
When it comes to candlestick patterns, one of the most important things to know is the meaning of Inside Up and Inside Down.
Simply put, an Inside Up candlestick pattern occurs when the real body of the candle is completely above the previous candle’s real body. This indicates that buyers are in control and that prices are likely to continue to rise. On the other hand, an Inside Down candlestick pattern happens when the real body of the candle is completely below the prior candle’s real body. This signifies that sellers are in charge and prices are likely to keep falling.
Knowing the meaning of these two candlestick patterns is essential for any trader who wants to be successful in their endeavors.
Bullish and Bearish Marubozu
In candlestick patterns, the meaning of bullish and bearish Marubozu can be determined by their position in relation to the trend line. If the Marubozu is found above the trend line, it is considered bullish. On the other hand, if the Marubozu is found below the trend line, it is considered bearish.
The size of the body also provides clues about the strength of the bulls or bears. A long bullish Marubozu indicates strong buying pressure, while a long bearish Marubozu indicates strong selling pressure. Short bodies, on the other hand, indicate a lack of conviction among market participants. Finally, the position of the shadow can also be used to determine whether a Marubozu is bullish or bearish.
 Bullish and Bearish Harami
A bullish harami is a candlestick pattern that forms when there is a small black candlestick followed by a large white candlestick. This pattern forms during a downtrend and signals that the trend may be reversing.
A bearish harami is the opposite of a bullish harami and forms when there is a small white candlestick followed by a large black candlestick. This pattern forms during an uptrend and signals that the trend may be reversing.
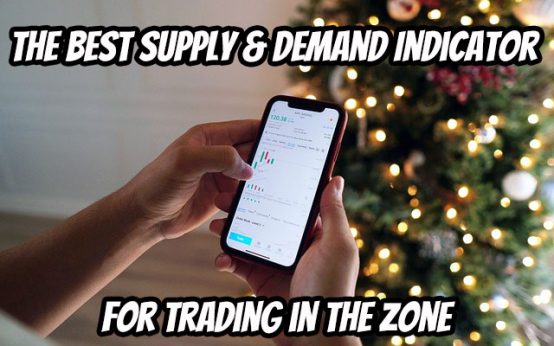 The Best Supply and Demand Indicator for Trading in the Zone
 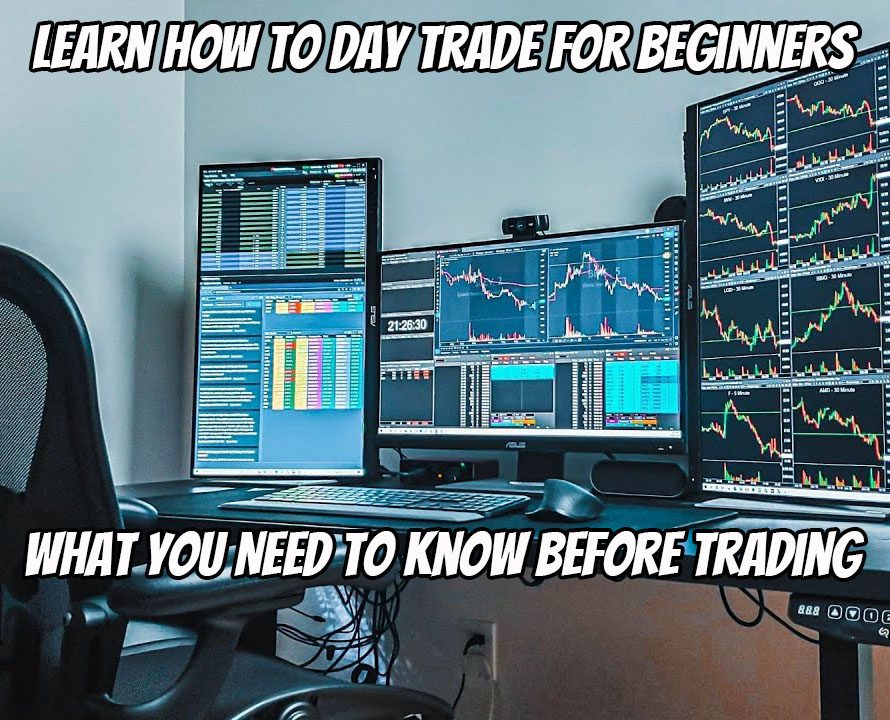 Learn How to Day Trade for Beginners – What You Need To Know Before Trading
 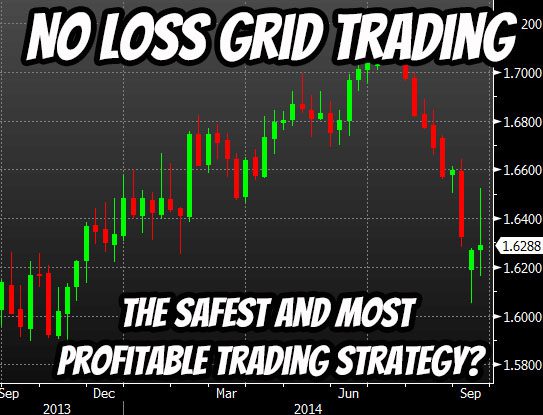 No Loss Grid Trading – The Safest and Most Profitable Trading Strategy?
 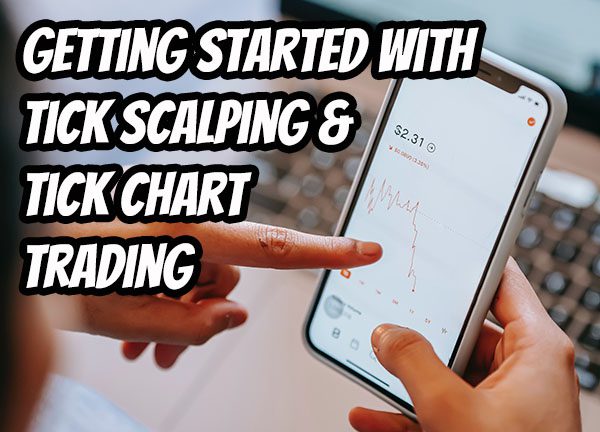 Getting Started With Tick Scalping & Tick Chart Trading
  Weekly Options Trading Signals: A Great Way to Make Money Or a Great Way to Go Broke?
  Base Camp Trading Review: Find Out If This Service Is A Scam Or Legit