If you’ve just started trading and are asking the question, “How does trading volume affect stock price?” I’ve got to compliment you on your ability to ask a fantastic question.
Not a lot of traders are looking closely enough at the market – or don’t investigate it enough – to ask such an important question.
And make no mistake about it – trading volume has a HUGE affect on stock price…as we’ll see in this article.
How Does Trading Volume Affect Stock Price?
There area a number of ways that trading volume affects stocks.
The first one we’ll look at is that when trading volume is low, oftentimes we will see larger gaps between the bid and ask prices of the buyers and sellers, respectively.
You can see a great example of this if you look at either the pre-market or after hours trading sessions.
As there is a lot fewer people trading – which results in a lot less trading volume – you can often see a lot larger spreads between the bid/ask when compared to the regular trading hours.
So in this case, trading volume (and the lack of participants) affect the stock price as your fill price will vary quite a bit – depending on who is currently at the table and willing to buy or sell.
The other thing that you want to do is watch the overall trend of the market.
Now, what a lot of traders will do (especially ones who have a technical style of trading) is to watch for certain stock chart patterns, evaluate whether the pattern matches the overall trend of the stock and then look for trading volume to reinforce their assumption as to the direction the stock is headed.
Of course, in order to do this you have to be able to spot profitable stock setups and part of that is being able to spot different trading patterns as they show up on the stock charts.
If you can’t do that, or don’t know where to start, I recommend the book by Samuel Goldman, “Bullish Charting – Profiting From Simple Positive Stock Setups”. You can pick up a copy here.
The other thing you can do (especially if you’re just learning to spot chart setups) is to use an artificial intelligence trade screener like this one here, which will alert you to certain positive trade setups.
So once you’ve got a certain trade setup spotted, the next thing to look for is whether or not the trade set up is headed in the overall trend direction of the stock.
For example, if you spotted a flag formation in CAT.
The next thing to do is to look and see the overall trend direction the stock was headed in before the flag formation was formed.
If it was headed up (IE the stock increasing in value) then it would be bullish flag and the flag formation would tend to indicate that the stock will go up in price. This means you would get ready to buy the stock (or call options) in anticipation of the stock going up.
If on the other hand, the value of CAT had been falling before you saw the flag formation, the trend would be negative and would indicate the stock had further to fall in price. This would leave you to believe you should either sell short, exit your current position or wait before buying more.
But BEFORE you actually pull the trigger, you’d want to double check and see whether the trading volume in the stock was there to support your thesis.
When you see trade volume increase and the stock moving in the direction you thought, that’s when you buy. (Assuming that the chart pattern and supporting trend is in line.)
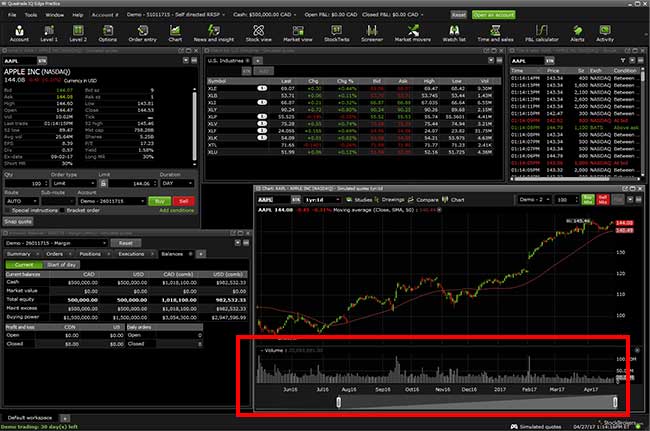
Not sure where to find the amount of volume for a stock that’s trading? It’s right at the bottom of the chart. (As you can see from the example image below using the Questrade trading platform here.)
If you’re watching things this closely and looking for a confirmation on trading volume, you’re going to be day trading.
Of course, you can use this strategy to look for a better entry point if you’re swing trading.
If you’re trading options you need to look at the stock’s volume to confirm the price movement. You won’t necessarily look at the volume of the option itself.
Our trade alerts are focused on swing trades. But if you’re a day trader watching the current trading volume of a stock is very important.
If this sounds exciting, I recommend you start by reading “Day Trading Manifesto – The Simple Art of Creating Wealth.” It’s a great starting place for trader’s of all level of experience.
With no trading volume, it can get pretty lonely out there if you’re looking to sell.
This is one of the reasons why I’m not a huge fan of trading penny stocks – because in a lot of cases these penny stocks are often bought by people who cause a huge run-up in volume and then sell all of a sudden, causing the value of the stock and the trading volume to tank.
And if you’re holding some of those penny stocks, you could end up holding them until they become basically worthless. And many people have lost big with this.
It’s a tricky thing with penny stocks. For starters, they have a really small float. (This is the number of available shares of stock to be sold.) This means that trading volume and therefore price can be manipulated easily. So if you have some less than scrupulous people trading these stocks…
And the OTC and pink sheet markets (where a lot of penny stocks live) are full of those kinds of people.
That’s not to say that you can’t make a lot of money trading penny stocks. A lot of people have, just like this guy who became a millionaire trading penny stocks. But I don’t like the idea of someone actively manipulating a stock.
What is trading volume?
Trading volume is the total number of shares or other units exchanged in a security or market during a specified time period. It can refer to trading activity on an individual stock, such as “XYZ Corp. (ABCD) experienced higher trading volumes today.”
It can also refer to trading activity in the entire market, such as “expected high trading volume today due to geopolitical events.”
How does trading volume affect stock price?
Trading volume affects stock price in a variety of ways, depending on the type and level of trading.
One way is by enabling larger orders (larger trades) to be quickly executed and providing traders with more information about what other traders are doing at any given time. Theoretically, this should improve prices for everyone because liquidity improves during high volumes. It can also affect prices by generating momentum, whereby people become emboldened after winning big at the market and start playing bigger to win an even bigger prize. People who think they’ve lost money start playing smaller too. All these dynamics push prices up or down faster than they would have moved if it were just one person trading against another single person.
What are the types of indicators that can help with trading volume analysis?
Volume indication, such as trading volume and turnover, can be used to help with analyzing investment choices. Volume indicators occur when an investor buys or sells a stock at ever increasing prices. The indicator’s effectiveness is dependent on short periods of time.
The most common type of volume indicator is called the Relative Strength Index (RSI). RSIs average between 0 and 100 and are calculated by dividing current day’s up closes by current day’s down closes; 50 is the median value for the RSI scale, so above 50 signals possible overbought conditions and below 50 signals possible oversold conditions.
What is highvolume trading?
High volume trading is an investment style that trades in large blocks of stocks with the intention of generating quick profits.
High volume traders generally buy and sell many millions worth of stock on a daily basis – often over 50 million shares every day (compared to the 10-20 million share transactions per day for an average equity analyst). The goal is to make quick movements, even 0.1% movement will be enough to trigger high profits for this style of trader. To do this they trade large numbers of invocations regularly throughout the day without holding any positions overnight since their strategy is based on being liquid at all times.
What happens when stock volume increases?
A few things happen when stock volume increases. First, with a higher volume of stocks trading, you can expect the prices to be more volatile, and your investment will likely move up and down quickly in value. Secondly while some investors wait for more information on a particular company before making a trade or while they read about new developments on any news sources, others may already have started buying the same mutual fund because it’s been moved up closer to their buy limit price.
How do you tell if a stock will continue to rise?
Technical analysis is an oft-used tool to predict the future price of stocks. It employs concepts from engineering, fluid dynamics, power management systems, economics, and other disciplines in order to identify trends that suggest what the next reasonable course for a stock’s value might be.
It can also evaluate factors that may affect these developments or intercept how an investor should respond to current market conditions.
What happens when a stock has no volume?
The stock would cease to be traded, and it would continue to exist as a historical notion.
Though the company would still exist, without investors, those organizations with no invested capital (i.e., those individuals who do not own any of the stock) could make no decision with respect to these assets. Without such people or organizations, there is nobody for this individual company’s shares to trade with; hence, if he were an investor in a small business with no other shareholders and that business failed miserably (it lost all its profits and then some), that investment would be worthless.
What makes a stock go up?
The factors that make a stock go up vary, and the market runs on supply and demand. An investor can control what they buy and keep their investments lower risk by investing in solid companies with strong fundamentals. Factors such as the company’s investment value, corporation size, price-earnings ratio, and ROE will play into how much money is put into that company at any given time. More people buying stock = more demand for that stock = higher prices for those shares of stocks. However another factor to consider when thinking about why a stock would go up is national economic trends such as inflation rates (i.e., an increase will lead to increased prices) or overall product/industry growth.
What was the largest stock increase percentage ever?
The largest stock increase percentage ever was 226,000% for the Scotts Miracle-Gro Company.
On January 8, 1996, Scotts shares were trading at $2.175 per share; less than two weeks later on January 22, the shares reached a high of $253.875 ($243 to put this in perspective). This amounted to an increase of 228% percent ($1 doubled). The reason for the explosive growth is that sales were good due to warm weather and gardeners fertilizing their plants before spring arrived. So one day CEOs started telling their employees “Let’s purchase more fertilizer so our inventory will last” which resulted in higher demand for product.
What does trading stock mean?
Trading is the process of buying and selling the ownership of certain assets or specific business.
Trading stock means that one is buying and selling companies’ stocks with the intention of making money on it. It’s considered to be one of the most popular fields in investment because it offers great flexibility, high return on an investor’s dollar, and good intellectual stimulation.
What is low volume trading?
Low volume trading is a strategy where the trader puts in orders only when stocks hit specific buy or sell points.
On low volume days, traders make the best of what little information there is to work with and try not to trade randomly. By waiting for significant price movements to occur, they give themselves the greatest chance of getting trades right. Another reason for this low-volume strategy is that it reduces the adverse affects from spreads, slippage and commissions on less-liquid securities. In any event, this type of trading needs patience and discipline – because if you’re trying to have targets that have a high likelihood of being hit then you’ll need very precise stop losses. Patience often pays off! For a good example read ”
What do you need to know about volume in stock trading?
The two things that an investor needs to keep in mind about volume are:
– A high volume typically indicates a market is strong and active. Markets with lower than average volume can be an opportunity for traders to take positions on the low-volume stocks, as they aren’t likely to affect prices much.
– An increased number of people trading on a stock not only increases the demand for shares, but may also increase volatility and thus bid ask spread. This can work against investors who want to sell their stock due to accounting or tax reasons at a certain price.
What are some best practices for trading with volume?
There are many different opinions about what constitutes a “good volume” or “bad volume.” There is also no set standard for trading on margin. It all depends on your risk tolerance and purposes.
When breaking down trade type by trade type, you would have to take into account the price of stock for sale for that trade, the intricacies involved with that particular broker/exchange, as well as your own personal tolerances. I recommend adding at least 50% more margin than you think is necessary per the above stated caveats just to be safe if you’re not sure how to go about calculating your risks with certain brokers/exchanges or stocks involved in your trades.
How to use a Volume Trading Strategy
Volume trading strategies are based on the concept that when there is a large amount of trading volume in an asset, it is more likely to be at the level of support or resistance.
Regarding how to use this type of strategy, traders typically trade with one minute intervals. This isn’t really feasible for most investors who are not professionals and have full-time employment outside of their investing activities. Another option would be to very loosely watch the markets by opening up multiple windows so you can catch certain levels being hit in different assets/markets without having to closely monitor them all together.
What is day trading volume?
It is a term used for measuring the activity level of traders has on market, or in other words “how active they are in buying and selling in the present time”.
Simply put, it’s how many people are in the markets. The higher day trading volume there is, the more likely there will be an influx of buyers or sellers which can move prices. Popular stocks like Apple (AAPL) often have high day trading volume because investors hold them for periods of less than one year. People who invest with longer-term investor horizons usually avoid high-volume investments like Apple (AAPL). So there’ll also be different levels of volume on stocks with different investment horizons if you’re looking at historical data.
Does a stock’s high or low volume mean it will increase or decrease in price?
High volume means higher demand and lower price. Low volume means lower demand and higher price.
More often than not, the more shares that trade of a company during its trading hours, the less value those shares have to investors. This is why stocks with high volumes tend to be volatile: because throughout any given trading day there’s no sure thing as to whether buyers or sellers will prevail, unless you know of something called shorting which allows you to bet on one of these sides but it usually requires buying up all those stocks first so it’s only for big players who can afford such an investment.
Why do stocks have varying volumes at different times of the day?
No one knows, but some people hypothesize this is because in the US the largest volume of trading in stocks happens when America wakes up, in other words 7am EST. But in Europe, trading doesn’t happen until 10 or 11am. So this could be a possible explanation for varying volumes throughout the day and give an answer to the question, “how does trading volume affect stock price?”
 The Best Supply and Demand Indicator for Trading in the Zone
  Candlestick Scanner MT4: How Does It Work & Does It Help?
  Learn How to Day Trade for Beginners – What You Need To Know Before Trading
  No Loss Grid Trading – The Safest and Most Profitable Trading Strategy?
  Getting Started With Tick Scalping & Tick Chart Trading
  Shark Fin Trading Indicator: Here’s How to Discover This Harmonic Trading Pattern