The Shark Fin Trading Indicator is a trend 💹 trading 🤑 indicator based on shark fin shape 🦈.
Steve Nison is one of the world’s foremost 🥇 technical analystss 🧐 and created 🎨 this 🤖 program.
The Shark Fin Trading Indicator is a trend trading indicator designed 🎨 to detect 🔍 trends across 🌎 time frames and markets to assist 🆘 traders in determining the direction of stocks 📈 by looking at charts 📊.
Of course, many people would rather just have trade alerts given to them, rather than messing around with charts or trying to learn the “ins and outs” of trading the market.
And if that sounds like you, The Empirical Collective can help with their incredible trade win rate (95.819% in some cases), exclusive trading tools and more value than any other competing trade alert service.
 Getting back to the topic at hand, this uses the shark fin shape as an indication of whether a stock is overbought or oversold, and forms a “V” or shark fin type shape.
The sharkfin pattern shows up on the chart when there is a big buy or sell in the market followed by an almost instant correction. It comes about because of an overbuy or sell in the market. On the chart, a V-shape forms, confirming the sell signal.
A lot of trading platforms have tools to automatically show you this formation, but we’ll cover exactly what to look for when you’re looking at your charts.
How Do We Confirm That It’s Actually a Shark Fin?
When a basic V-shaped pattern appears, the sharkfin pattern can be misinterpreted, so how can we know if there is an overbuy or oversell?
Simply put, we use the Relative Strength Index (RSI).
This is a great confirmation, as the RSI measures how strong the price action for a certain asset is.
Price action below 30 RSI is considered oversold, while price action beyond 70 is considered overbought.
When the RSI indicates an over-buy/over-sell on the RSI, the Sharkfin pattern is confirmed.

How Do I Trade the Shark Fin?
When it comes to reversing downtrends:
Double check and make sure that the sharkfin formation is truly there.
Then wait for the RSI to fall below 30, indicating that the asset is oversold.
After a strong bullish rise (where the price increases), the RSI should quickly climb back over 30.
You want to enter the trade as soon as a candle closes above the 30 RSI level.
Stop Loss
Set a stop loss at the low of the sharkfin.
Take Profit
Take profit when the profit level is equal to the distance between the stop loss and where you opened the trade.
For Reversing Bullish Uptrends
Again, make sure that the sharkfin is actually there.
Then wait for the RSI to rise over 70, to prove that the asset is overbought.
Once this has happened, it should be followed by a negative move, where the RSI swiftly dips below 30.
To trade this, as soon as a candle falls below the 70 RSI level, open a trade.
Stop Loss
Set your stop loss to a level slightly above the positive rise of the shark fin.
Take profit
You want to take profit when the estimated profit is equal to the distance to the stop loss.
Here are 5 Tips to Setting Up High Probability Trades
Regardless of whether you’re using a harmonic shark pattern, any form of price pattern, fibonacci lines in your strategies, they all have to be used within a framework to help you set up high probability trades.
With that in mind, here are 5 tips to do just that.
The first step is to set up the trade
The setup is the collection of requirements that must be met before any stock trade can be considered. If you’re a trend-following trader, for example, a trend must be present. A tradable trend should be defined in your trading plan (for your strategy). This will prevent you from trading when there isn’t a trend. Consider the “setup” to be your rationale for trading.
If you don’t have a good reason to trade that fits your strategy, don’t trade.
But if the setup—your purpose for trading—is there, go on to the next stage.
The second step is to define the trade trigger
Even if you have a purpose to trade, you still need a specific occurrence to signal that it is time to trade.
After the stock has fluctuated or pulled back, some traders like to purchase on fresh highs.
During a decline, some traders like to purchase. When the price pulls back to a level of support, wait for a bullish engulfing pattern to emerge or for the price to consolidate for several price bars before breaking above the consolidation. Both of these are specific occurrences that distinguish trading opportunities from all other market changes (for which you have no approach).
However, before pulling the trigger on a trade, be certain that the trade itself is worthwhile.
You always know where your entry point is in advance when you use a trade trigger. This gives you enough time to double-check the trade’s legitimacy (steps three through five) before committing to it.
The third step – the stop loss
Knowing your trade trigger and having the correct entry isn’t enough to make a good trade. A stop-loss order should also be used to manage the risk on the deal if you’re purchasing stock.
A stop loss can be placed in a variety of ways, but it’s most often put just slightly below a recent swing low for long trades and just slightly above a recent swing high for short bets.
Another strategy is the Average True Range (ATR) stop loss, which includes putting the stop-loss order based on volatility a particular distance from the entry price.
The fourth step is to set a price target
You now know whether the conditions are suitable for a trade and where the entry point and stop loss will be placed.
The next thing to keep in mind and consider is the profit possibility.
A profit objective is based on something that can be measured rather than being set at random. For example, chart patterns give goals dependent on the pattern’s size. When purchasing near the bottom of a trend channel, you’ll establish a price objective near the top of the channel; if selling near the top of the channel, you’ll put a price target near the bottom of the channel.
Based on the patterns of the market you’re trading, decide where your profit objective will be.
Profitable trades can also be exited using a trailing stop loss. You won’t know your profit potential in advance if you choose a trailing stop loss. That’s good, because the trailing stop loss lets you to profit from the market in a systematic (rather than random) way.
The fifth step – the risk to reward ratio
Make an effort to only enter deals when the reward possibility exceeds 1.5 times the risk. If the price reaches your stop loss, for example, you should make $150 or more if the goal price is met.
Before initiating or starting the trade, however, you should examine if the profit potential will outweigh the potential loss.
Walk away if the profit potential is equal to or less than the risk. It’s possible that you’ll put in all this effort just to discover you shouldn’t even place the trade.
It’s just as crucial to avoid terrible trades as it is to participate in good ones if you want to succeed.
People Also Asked These Questions When Looking for Info on a shark fin trading indicator
What is shark fin pattern trading?
The shark fin pattern is a popular trading strategy among traders and investors. It involves the use of an indicator that measures momentum in order to predict when stocks are going to make major moves.
What is the harmonic shark pattern trading strategy?
It’s just another name for what we’ve been discussing 😉
What is bullish shark pattern?
Essentially a bullish shark pattern is when an asset drops below the 30 RSI level and then almost immediately rebounds back up past the 30 RSI level.
How do you measure a shark pattern?
You measure a shark pattern by using the RSI (Relative Strength Index) to help determine whether an asset is oversold or overbought.
What is TDI in forex?
TDI refers to the Traders Dynamic Index. This particular meta trader indicator is a fairly well used indicator that makes use of RSI, and volatility bands (based on Bollinger Bands) to provide traders with a complete picture of the state of the FOREX market.
What is the shark indicator?
It’s a trading indicator used by traders when looking for an entry or exit point of a trade.
Forex Shark Pattern
The shark fin trading indicator is a harmonic pattern that uses the RSI to determine an entry or exit point. Here’s how to spot it perfectly:
Shark Indicator
The shark pattern indicator uses the RSI to show an over bought or over sold price pattern to determine the next direction the stock will take.
How does the shark fin pattern form?
It forms with a sharp movement in past certain levels on the relative strength index.
When a simple v-shaped pattern occurs, so how do we confirm if there’s an overbuy or oversell?
This is where you have to use the RSI to confirm the trend.
What is a shark fin options strategy?
Shark Fin Options are a type of knock out option that includes a built-in mechanism that closes the option if a predetermined price level (yes, you guessed it: the knock-out price) is exceeded before the option contract expires.

 The Best Supply and Demand Indicator for Trading in the Zone
  The Best Way to Learn Options Trading: A Guide for Beginners
  Candlestick Scanner MT4: How Does It Work & Does It Help?
 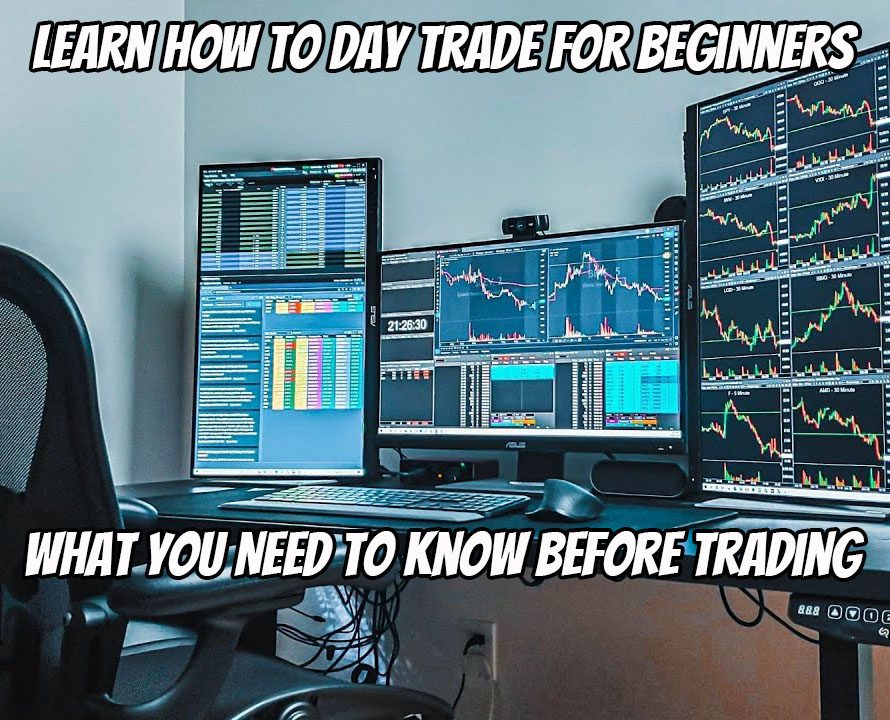 Learn How to Day Trade for Beginners – What You Need To Know Before Trading
 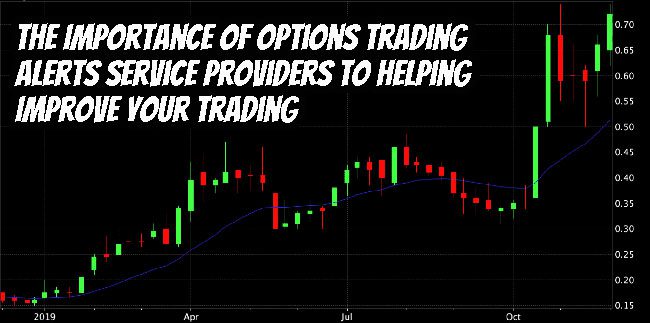 The Importance of Options Trading Alerts Service Providers To Helping Improve Your Trading
 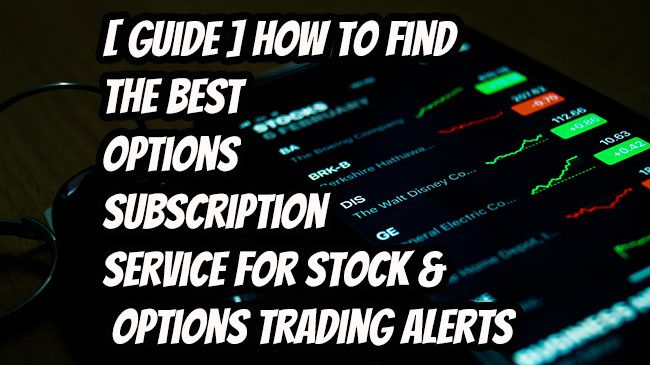 Here’s How to Find The Best Options Subscription Service for Stock and Options Trading Alerts