If you’re new to trading options, one of the first questions you’ll often have is, “How to read options chains?”
And if you aren’t used to looking at them, they can be pretty confusing as there’s a lot more going on there than if you’re trading regular stocks.
But it’s something that you have to be familiar with and comfortable reading if you’re going to trade options.
And is it worth the work?
I say that it is, as trading options gives you a chance to risk a little in order to potentially make a lot.
And, well, there are so many more options that you have when you’re.. ah, well, trading options 🙂
So let’s get into this so you can become an expert options chain reader in no time.
And the quickest way to do that is to pull up an options chain and dive right in.
How to Read Options Chains
To get going, let’s look at the options chain below for Tesla.
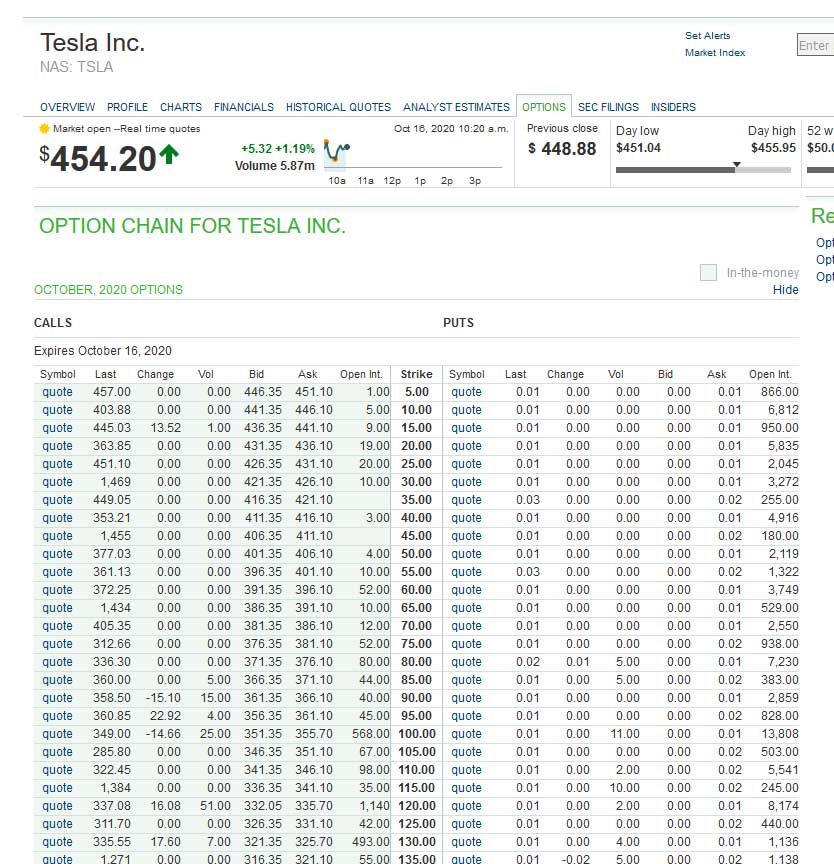
Right off, you can see that Tesla’s currently trading at $454.20 – and so this isn’t any different than if you were trading stocks.
The next thing of note is to look at the 2 columns at the top labelled “CALLS” and “PUTS” as you can see below.
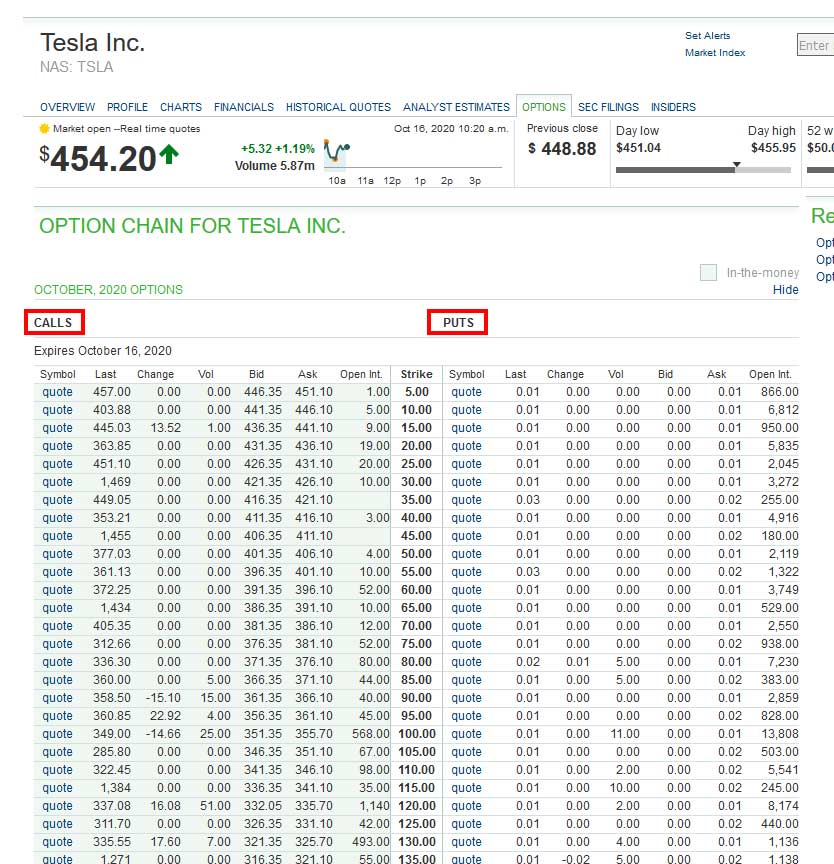
Calls and Puts are the foundation of trading options.
If you buy Calls, you are buying the right to buy the stock at a certain price. You don’t HAVE to purchase it at this price, but you have the option or right to do so if you wish.
Puts, on the other hand, give you the right to sell the stock at a certain price. Again, you don’t HAVE to purchase it at this price, but you have the option or right to do so if you wish.
For our attempts here – and to keep things super simple – I’m only going to cover buying calls and puts for now (you can sell them as well, but that’s more of an advanced thing and for now we’ll just leave it alone while you’re learning the basics).
As I’m sure you’re beginning to see, there are a number of things to understand when you’re trying to learn how to read options chains.
The next thing you want to look at is the strike price.
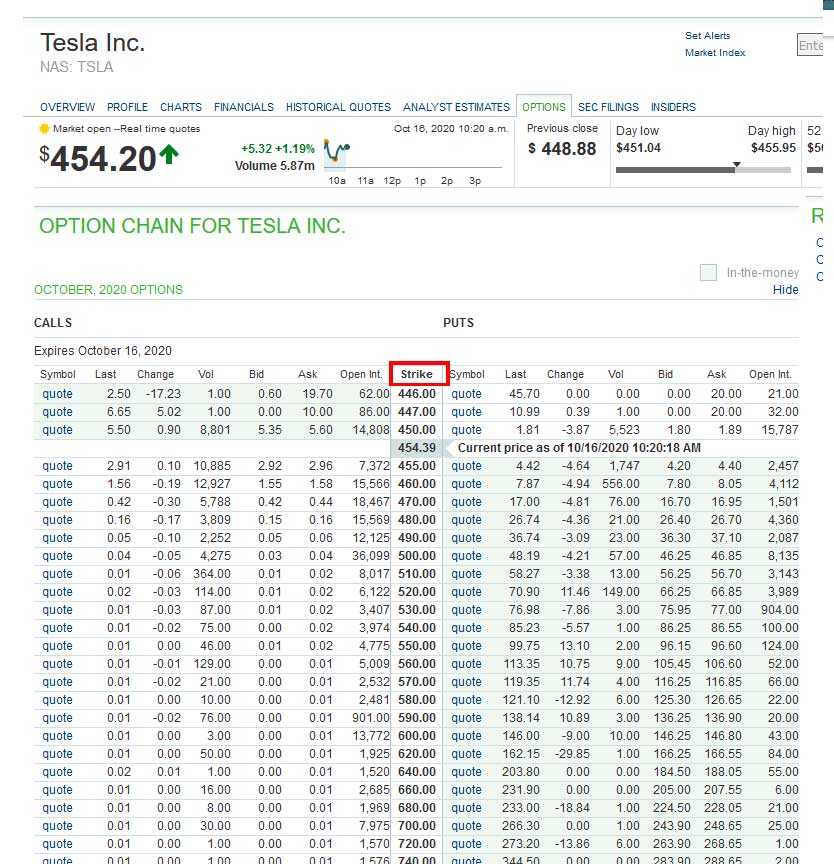
The strike price is the price at which you can either buy or sell the stock.
So, using our basic example of only buying options, if you were to buy calls, and the strike price is lower than the current trading value of the stock (in this case if you were to buy the 446 strike calls and Tesla is trading at 454.39) then your call option is said to be “in the money”.
On the other hand, if you were buying put options and bought the 455 puts while Tesla was trading at 454.39, your put options would be “in the money.”
And when you’re buying options, you want them to be “in the money” at the option expiry date.
So if you’re buying calls, you’re basically saying that the price of Tesla stock will be higher than the strike price you purchased the option at come the expiration date.
If you’re buying puts, you’re saying that the price of Tesla stock will be lower than the strike price you purchased the option when it expires.
Something To Keep In Mind
The closer the strike price is to the current trading value of the stock, the more expensive buying the call or put will be.
The next thing that you will want to look at is the option expiration date, which you can see in the image below.
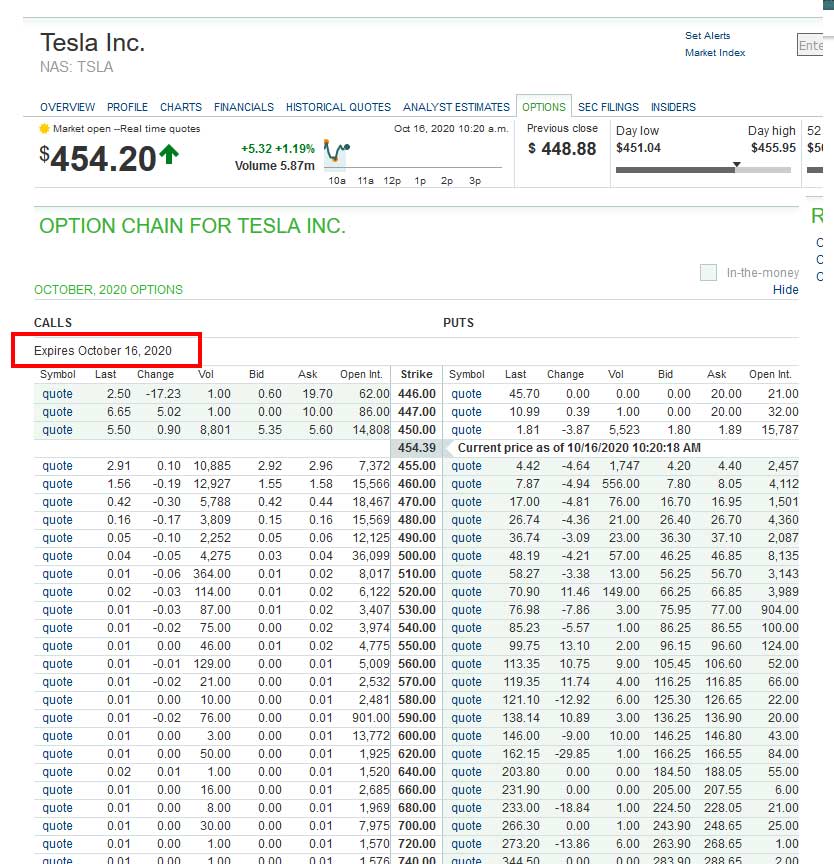
This is the date when the option contract you buy expires. So this is the date by which you need the stock price to be trading at or above the strike (if you buy calls), or at or below the strike (if you’re buying puts).
Now that we’ve got that out of the way, we need to be able to identify what it will cost you to buy 1 option. And this is easily done when you’re reading an options chain and it really isn’t much different than when you’re trading stocks.
What you want to look for is the “BID” and “ASK” prices on either the Call or Put side.
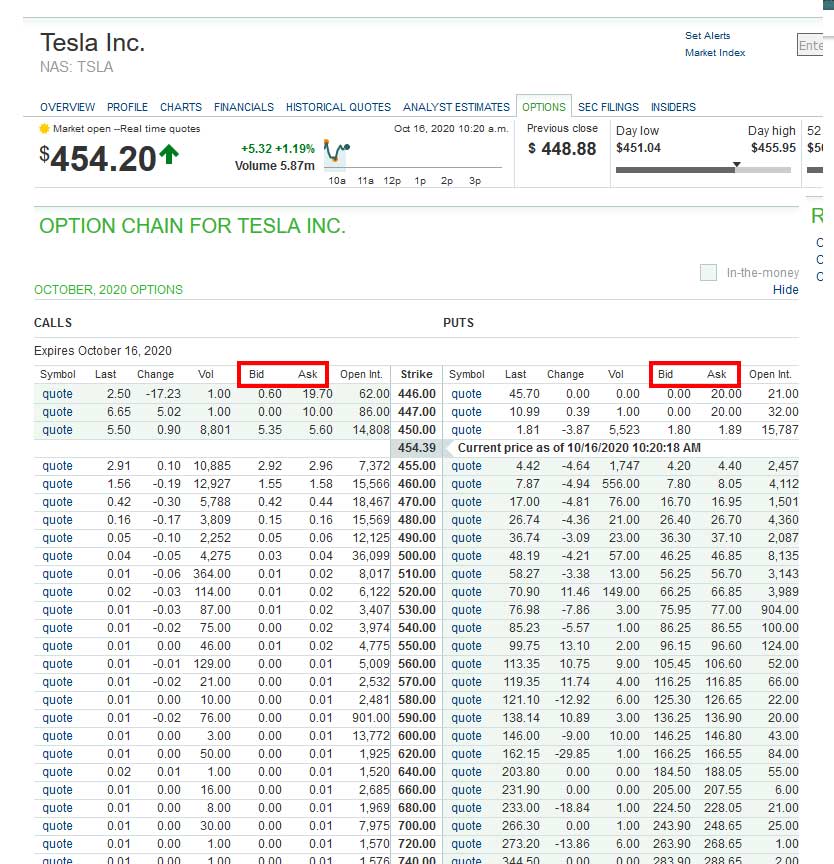
So if you are wanting to buy some “out of the money” calls on Tesla, let’s say you’re looking to buy the 460 strike Calls. The cost for this would be between the Bid and Ask price (just like when trading stocks) and is generally somewhere in between the Bid and Ask. So in this case, it would probably cost you $1.57/contract.
With options, each contract typically controls 100 shares of stock, so your total cost would be $1.57 x 100 shares = $157.
So for $157, you are saying that by October 16th the price of Tesla will be at or above $460. And if it is, the price of the Calls you bought will increase in value and you’ll make money.
It’s the same process on the Put side.
If you thought the price of Tesla was going to drop to 450 or lower by October 16th (the option expiry date), you could buy the 450 strike Puts for $185 ($1.89-1.80/2, 0.05+1.80, x 100 shares).
And then if the price of Tesla dropped to 450 or lower on October 16th you would make money.
So , these are the basics of how to read options chains using simple, directional options trades when buying Calls or Puts.
And these are the exact sort of trades that we use inside “The Empirical Collective”. We issue simple, directional trade alerts for buying Calls or Puts to our members, making them really easy to follow and execute for traders of any experience level.
On the other hand, if you’re ready to go and want to start trading, you can sign up for an account inside “The Empirical Collective” and trade along with us by clicking this link here.
We’ve had some great success making these simple trades and if you’re looking to start making some money asap this is a great place to do it. You can join using the discounted link here.
Common questions other people search for when they’re asking how to read options chains
How do you read an option chain?
The cheapest call option will be at the top of the list, followed by the most expensive. Obtaining a description is as easy as lifting your finger to scroll down and reading up through those left on screen.
Typically options are listed according to height and color – height is determined by how far away from expiration it is, with blue being furthest out and red being closest; colors correspond to how much you need to invest in order to buy that particular option contract (so dark grey would be $200 per contract or $20 for 10 contracts).
How do you analyze option chain data?
1. For each option, find the following information: Strike price, expiration date (Friday of the week), and number of contracts (each box represents 100 shares).
2. Plot all options along a horizontal line with strike prices increasing from left to right and expiration dates increasing from top to bottom. Keltner channels will be shown on both sides of this chart for visual reference.
3. Choose a “side” that you feel is most likely the direction option chain data will move in and place your initial buy/sell stop just below or above some pivot point where you’re confident people will either accumulate or sell out their positions before an earnings release.
What does option chain indicate?
Option chains show the prices and volumes for different options at different strike prices.
It can also be less than one year.
Option chains help investors figure out the probability of exercising a specific option at various strike prices, based on current market conditions. The numbers in an option chain show what percentage of contracts will expire with “in-the-money” status at that strike price and expiration date.
For example, if 52% of contracts were determined to be in-the-money, then it would mean there is a 50/50 chance that you would exercise that contract when it comes time to sell or buy under your limits at the last day of trading.
Do you buy at the bid or ask?
You buy at the ask. Bids go up, so do asks. Never one without the other!
The bid price is the price you are willing to pay for shares of stock, whereas the ask price is what someone else is asking. You can think of it this way: The bid represents what you’re doing to get in line for an item (the number of dollars you’re willing than than something would cost on average), and the ask represents how many people in front in line there are demanding that same product (hence why its higher).
What’s the difference between an option and a stock?
The difference between an option and a stock is the amount of skin in the game. A stock is generally much riskier because its price can fluctuate based on many factors, including bad news about the company and lawsuits against it.
Whereas an option gives you far greater control over how much you gain or lose by choosing the strike price, the tenure period and whether to buy or sell (unlike stocks where all these decisions are made for you). This means if something’s gone wrong with your investment, like if it never reaches or exceeds your target selling prices for example or dips heavily-enough in value that you might not be able to meet margin call requirements, then cancelling exercisable options before they expire will allow them to expire.
What is rsi?
RSI (Relative Strength Index) is a relative-strength trading indicator. It attempts to determine when there is an overbought or oversold level in the market.
The calculation for this ubiquitous index involves dividing the “average true range” by the “standard deviation of all up days.” The resulting quotient represents the general bullishness of a stock over a given time period–the higher the number, the more bullish it is with stocks being considered to be bought when they have risen above their one-month high and near a resistance point.
What are options?
Options are a type of financial contract that gives the buyer the right, but not the obligation, to buy or sell an underlying asset — usually a share in a company’s stock — at predetermined future time and price.
Most people invest in stocks because it is both simple and cheap. The simplest way is with options contracts which allow you to either buy future assets at a fixed price or sell them for cash before you have to pay for them up front. It’s very much like going shopping when your budget runs out: you can use your credit card to finance whatever purchase make without exceeding your limit in terms of what you could afford if money were not an issue!
If you’d like some more information, there are is something called an option alert service that provides you with trade alerts whenever they think a certain option contract is about to increase in price.
What does option chain indicate?
Option chain refers to the different prices at which an option can be purchased at a given point in time. As options are priced in US dollars, so the cheapest option will have its price listed first followed by more expensive options with their prices incrementing upwards. For example, if ABC stock is trading at 45$ but you want to buy it for 50$, then call option 1 would have a strike price of 45$, while call option 2 will have a strike price of 50$. The difference between these two calls would be calculated over 100 shares ($10). Once your understanding increases I recommend that you get Bloomberg to aid further education or alternatively get free resources from the internet.
What is a good put call ratio?
A good put call ratio is typically about 10%.
10% of your investment should be in puts. The other 90% should be in calls because capital gains are always taxed at a higher rate than linear losses, so investors tend to take lots of “capital losses” over time just by keeping the market up–a lot more than they’re likely to see with simple trading. So you can take some big loses on calls and get it all back with capital gains on the puts. You don’t need many puts if you’re judicious.
What is Nasdaq?
Nasdaq is the largest stock market in the world by total number of listed companies, market capitalization, and share volume.
It includes over 3,000 domestic and international listings across 240 countries. It’s also home to major indexes like the S&P 500 index (aka Standard & Poor’s 500 Index) and the Dow Jones Industrial Average — which are both part of what we know colloquially as “the stock market.”
What is put option?
A put option is a contract that allows you to purchase an asset at a set price within a given time frame. When the item reaches the purchaser’s “strike price” before expiration, meaning it has fallen below it, the purchaser can exercise their right to buy this asset which will make them up the difference plus an addition sum of cash.
What is P E ratio in stock market?
P E ratio or price to earnings ratio is the market value of a company divided by its earnings per share. What this tells you is how many years worth of incomes it would take to buy all its shares at the price given.
A low P/E indicates that stockholders are getting a great deal from their investment, while a high P/E may signal overvaluation and future poorer performance.
In finance, the Price–earnings ratio (P/E), also known as the “multiple,” can refer both to different kinds of ratios for determining a stock’s valuation relative to various other things including corporate earnings and total shareholder return.
When do options chains update?
Options chains are updated when market brokers update the options board in order to reveal new prices in the available stocks.
The regularity at which markets come in for trading is determined by how they are organized. Markets that offer continuous trading – once per day, for example – update their listings of stock offerings continuously every 15 minutes. Occasionally, a specialist might interrupt this process to update its options or futures prices more frequently if it has an exceptionally large volume of trades that have just occurred. These are called “specials” and their occurrence will be announced on screens scattered throughout the floor so traders can keep track of what’s happening without risking too much money along the way.