When you’re looking to start trading in the stock market, there are a few different things you need to learn. In this blog post, we’re going to teach you about tick scalping and tick chart trading. Both of these methods can be extremely profitable if done correctly, but they do require a bit more learning than some of the other trading techniques out there. Don’t worry though – we’ll walk you through everything you need to know! By the time you finish reading this post, you’ll be ready to start trading like a pro.
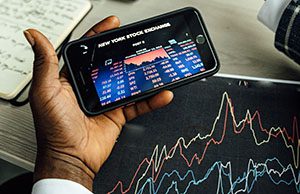 What Is Tick Scalping?
Tick scalping is a trading strategy that involves buying and selling securities based on small changes in price. The name comes from the fact that traders look for “ticks,” or small price movements, to profit from. Tick scalping can be done in any market, but it is most commonly used in the stock market. To be successful at tick scalping, traders need to have a very good understanding of market movement and be able to make quick decisions. It is also important to have a firm understanding of risk management, as tick scalping can be a very risky strategy. While there is no guarantee of success, tick scalping can be profitable if done correctly.
Tick scalping uses charts with a smaller time frame. Using these charts, traders can see trade setups in real-time and make profits if they have an exit strategy. In other words, tick scalping allows for more opportunities to make money as you’re able to act quickly on price changes.
A tick chart is a way for traders to track the price of a trade. Unlike traditional charts which show data over fixed intervals of time (e.g., 1 minute, 5 minutes, 15 minutes), tick charts refresh prices on demand so that they always show the most current information possible. This makes it easier for scalp traders to identify new trading opportunities in real-time as they happen.
Getting Started With Tick Chart Scalping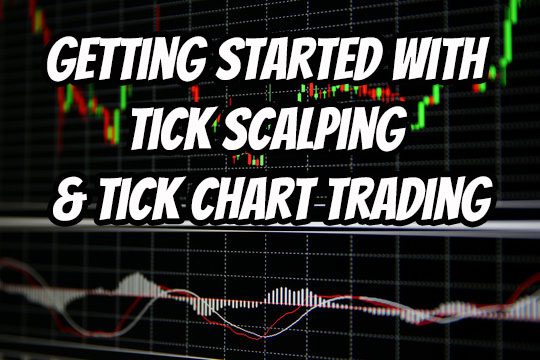
If you’re interested in tick chart scalping, there are a few things you need to know before you get started.
First of all, tick charts are different from traditional charts because they show every trade that occurs, regardless of volume. This can be useful for spotting small changes in momentum. Secondly, tick chart scalping requires a lot of patience and discipline, as you’ll be looking for very small movements in price. Finally, you’ll need to use a broker that offers tick data – not all brokers do. With that said, let’s take a look at how to get started with tick chart scalping.
To start, you’ll need to set up your charting software to display tick data. This is usually done by selecting “ticks” as the data source, rather than “time.” Once you’ve done that, your software will begin displaying every trade that occurs. From there, it’s up to you to interpret the price action and make trades accordingly. As we mentioned earlier, this requires a lot of patience and discipline – but if you can master it, tick chart scalping can be a very effective trading strategy.
What are Some Scalping Trading Strategies?
There are a few different scalping trading strategies that you can use. One common strategy is called marking making, where a trader enters a buy order and an offer for the same stock at the same time. This technique allows you to control the price of the stock and get better execution prices.
Another common scalping strategy is buying large amounts of shares and waiting for tiny price movements to occur. This approach gives you the opportunity to make a small profit on each trade but requires a lot of patience.
Regardless of which strategy you choose, it’s important to remember that your risk/reward ratio should be 1:1 in order to ensure maximum profit potential.
Best Tick Chart For Scalping In 2022
 When it comes to trading, the tick chart is one of the most popular tools. It’s based on forex quotes and doesn’t show the size of trade volume, but it does give you a good idea of when to enter and exit a trade. Many traders use this type of chart when scalping, which is a short-term trading strategy that involves taking small profits over time.
If you’re just starting out in trading, then the tick chart is a good place to begin. Try using it with one-minute candles for a few weeks before moving on to more complicated strategies. This will help you get comfortable with how the market moves and learn how to spot profitable trades.
Best Tick Chart Settings & Other Customizations
Charting is essential for day trading success. Without a clear picture of what the markets are doing, it’s impossible to make informed decisions about where to enter and exit trades. Tick charts are a popular tool among day traders, as they provide a concise view of market activity. However, setting up a tick chart can be tricky, and there are a few important things to keep in mind.
First, it’s important to choose the right data source. The most accurate tick chart will be based on real-time data from a reliable source such as a professional trading platform. Second, it’s important to choose the right settings for your chart. The most common settings are 1 tick per candle and 2 ticks per candle, but you may need to experiment to find what works best for you. Finally, don’t forget to customize your chart to suit your needs. You can add indicators, change the color scheme, and even save multiple presets if you want to quickly switch between different views. With a little bit of practice, you’ll be able to set up tick charts that help you make better trading decisions.
The more experience you have with Tick Charts and other customizations, the better off you will be when trading live. Always remember that paper trading is essential before risking your hard-earned money in the markets!

The Risks of Tick Chart Trading
Tick charts can be a great tool for traders, but they also come with risks. One of the biggest dangers is that tick charts move so quickly that traders may not have time to react properly. If you’re using a tick chart to make trading decisions, it’s important to be aware of these risks and take them into account when making your trades.
Another issue with tick charts is the data feed. Because there are so many different sources of data, it can be difficult to get an accurate picture of what’s going on in the market. This can lead to bad trades and losses for traders who rely too heavily on tick charts.
Even though there are risks associated with tick chart trading, that doesn’t mean it isn’t worth doing. In fact, if used correctly, tick charts can give traders an edge in day trading rules.
Tick charts should always be used in conjunction with time-based charts to get a more complete view of the market. By understanding both types of charts, traders can minimize the risks associated with using tick charts exclusively

Frequently Asked Questions
How do you calculate the value of a tick?
The value of a tick is determined by the instrument's volatility and the number of contracts traded. The equation is: value = (tick size * volume) / (number of contracts) In this example, we will use the ATR to calculate the number of contracts. ATR indicates an instrument's volatility. Volatility determines the number of profit targets in a position. The stop is placed at the entry price minus (plus, for short positions) 3x the ATR. So, if you have an ATR reading of 10 on your chart, then you would enter with a stop three times that distance away from your entry point - or 30 points in this case.
Is scalping good for beginners?
Yes. Scalping is a trading strategy that involves holding a position for a very short period of time, typically just a few minutes. The goal is to make small profits on a large number of trades, rather than looking for a few big winners. For this reason, scalping is often considered to be a good strategy for beginners. Beginners are often advised to start with small trades and to focus on building up their skills and confidence before moving on to more advanced strategies. Scalping can be an effective way to learn the basics of trading without taking on too much risk. However, it is important to remember that scalping is a high-pressure strategy that requires quick reflexes and a willingness to take risks. Not everyone is suited to scalping, and it is important to find the right trading strategy for your personality and goals.
What is tick value in trading?
In trading, the tick value is the minimum change in price that security can have. For example, if a stock is trading at $10 per share, the tick value would be $0.01. This means that the stock cannot go up or down by less than $0.01 in a single trade. The tick value is important because it determines the minimum amount that a trader can make or lose on a trade. If a trader buys a stock for $10 per share and the stock goes up by just one tick, the trader would make $0.01 on the trade. Conversely, if the stock goes down by one tick, the trader would lose $0.01. As such, the tick value can have a significant impact on a trader's profitability.
Which timeframe is best for scalping Crypto?
There is no definitive answer to this question as it largely depends on the individual trader's preferences and strategies. However, shorter timeframes (1-5 minutes) are typically better for scalping cryptocurrencies, as there is more price movement and volatility in these markets.
Are tick charts better for day trading?
There is no one-size-fits-all answer to this question. Tick charts show four candles per bar, which gives an updated view of the market from different angles and better represents the volatility in prices with minimal effort to interpret. The dark tick chart lags behind the lighter, time tick chart in order to give users more information on the current state of the market. The tick chart is a lower resolution view of price movement, so it can be difficult to discern small changes in price. However, there are pros and cons to both chart types - it ultimately depends on what you are looking for as a trader.
 The Best Supply and Demand Indicator for Trading in the Zone
  Candlestick Scanner MT4: How Does It Work & Does It Help?
  Learn How to Day Trade for Beginners – What You Need To Know Before Trading
  No Loss Grid Trading – The Safest and Most Profitable Trading Strategy?
  Weekly Options Trading Signals: A Great Way to Make Money Or a Great Way to Go Broke?
  Base Camp Trading Review: Find Out If This Service Is A Scam Or Legit